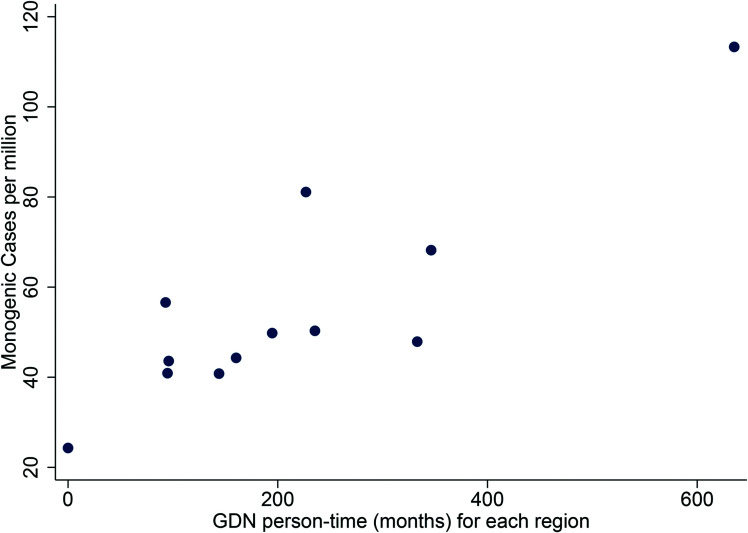
Figure 3.
Association between GDN involvement and confirmed cases across the U.K. Each point represents a region of the U.K., with GDN person-time in months on the x-axis against cases diagnosed with confirmed MODY per million population on the y-axis. Association determined using Pearson correlation coefficients (r = 0.86, P < 0.001).

