. 2022 Mar 8;12(3):712–729. doi: 10.1158/2159-8290.CD-20-0930

Figure 4.

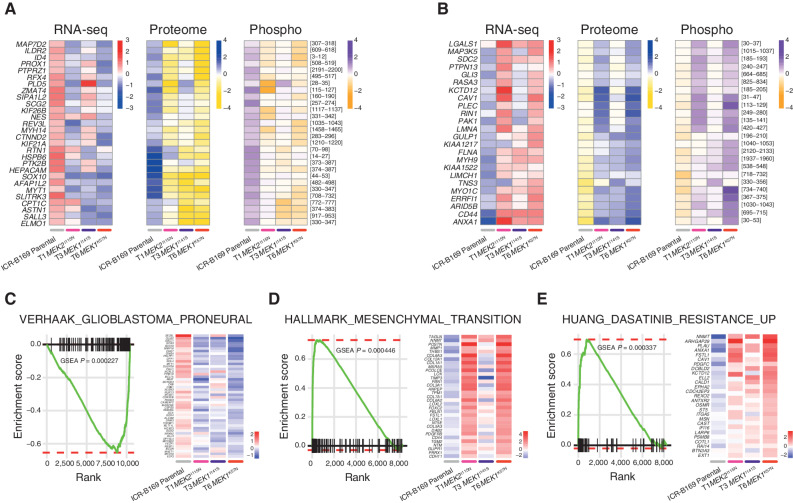
Figure 4. Integrated gene and protein expression profiling of trametinib-resistant DIPG cells. A, Coordinately downregulated genes (left), proteins (middle), and phospho-sites (right) in all three trametinib-resistant subclones of ICR-B169 BRAFG469V cells as compared with parental. B, Coordinately upregulated genes (left), proteins (middle), and phospho-sites (right) in all three trametinib-resistant subclones, as compared with ICR-B169 parental (gray). T1, MEK2I115N, pink; T3, MEK1I141S, purple; T6, MEK1K57N, red. C, GSEA enrichment plots for the signature VERHAAK_GLIOBLASTOMA_PRONEURAL in T6 MEK1K57N cells compared with ICR-B169 parental. The curves show the enrichment score on the y-axis and the rank list metric on the x-axis. Alongside is a heat map representation of expression of significantly differentially expressed genes in the signature in all three trametinib-resistant clones compared with parental. D, GSEA enrichment plots for the signature HALLMARK_EPITHELIAL_MESENCHYMAL_ TRANSITION in T6 MEK1K57N cells compared with ICR-B169 parental. The curves show the enrichment score on the y-axis and the rank list metric on the x-axis. Alongside is a heat map representation of expression of significantly differentially expressed genes in the signature in all three trametinib-resistant clones compared with parental. E, GSEA enrichment plots for the signature HUANG_DASATINIB_RESISTANCE_UP in T6 MEK1K57N cells compared with ICR-B169 parental. The curves show the enrichment score on the y-axis and the rank list metric on the x-axis. Alongside is a heat map representation of expression of significantly differentially expressed genes in the signature in all three trametinib-resistant clones compared with parental. T1, MEK2I115N, pink; T3, MEK1I141S, purple; T6, MEK1K57N, red.

Integrated gene and protein expression profiling of trametinib-resistant DIPG cells. A, Coordinately downregulated genes (left), proteins (middle), and phospho-sites (right) in all three trametinib-resistant subclones of ICR-B169 BRAFG469V cells as compared with parental. B, Coordinately upregulated genes (left), proteins (middle), and phospho-sites (right) in all three trametinib-resistant subclones, as compared with ICR-B169 parental (gray). T1, MEK2I115N, pink; T3, MEK1I141S, purple; T6, MEK1K57N, red. C, GSEA enrichment plots for the signature VERHAAK_GLIOBLASTOMA_PRONEURAL in T6 MEK1K57N cells compared with ICR-B169 parental. The curves show the enrichment score on the y-axis and the rank list metric on the x-axis. Alongside is a heat map representation of expression of significantly differentially expressed genes in the signature in all three trametinib-resistant clones compared with parental. D, GSEA enrichment plots for the signature HALLMARK_EPITHELIAL_MESENCHYMAL_ TRANSITION in T6 MEK1K57N cells compared with ICR-B169 parental. The curves show the enrichment score on the y-axis and the rank list metric on the x-axis. Alongside is a heat map representation of expression of significantly differentially expressed genes in the signature in all three trametinib-resistant clones compared with parental. E, GSEA enrichment plots for the signature HUANG_DASATINIB_RESISTANCE_UP in T6 MEK1K57N cells compared with ICR-B169 parental. The curves show the enrichment score on the y-axis and the rank list metric on the x-axis. Alongside is a heat map representation of expression of significantly differentially expressed genes in the signature in all three trametinib-resistant clones compared with parental. T1, MEK2I115N, pink; T3, MEK1I141S, purple; T6, MEK1K57N, red.