Figure 5.
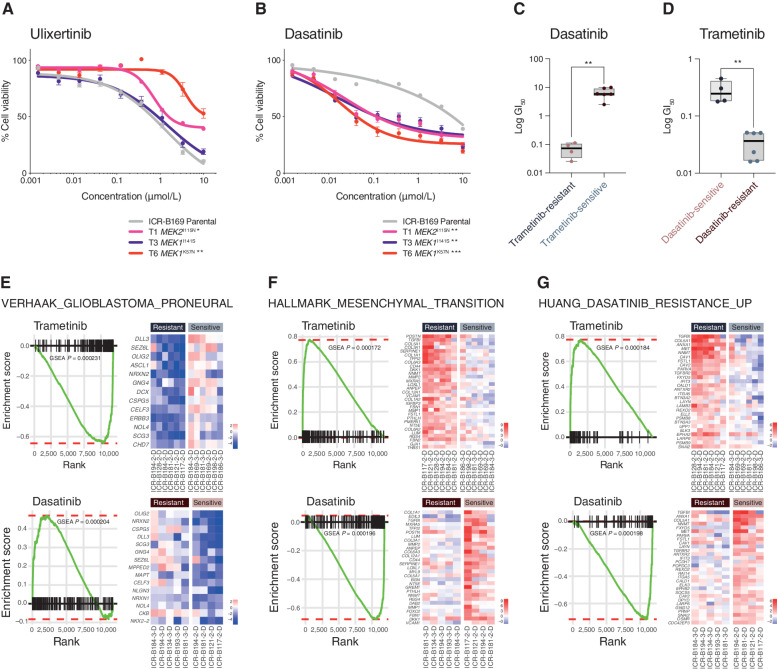
Reciprocity of drug sensitivities and gene expression signatures between trametinib and dasatinib in DIPG cells. A, Dose–response curves for ulixertinib tested against ICR-B169 parental cells (gray) and resistant clones T1 (MEK2I115N, pink), T3 (MEK1I141S, purple), and T6 (MEK1K57N, red). B, Dose-response curves for dasatinib tested against ICR-B169 parental cells (gray) and resistant clones. Concentration of compound is plotted on a log scale (x-axis) against cell viability (y-axis). Means plus standard errors are plotted from at least n = 3 experiments. *, P < 0.05; **, P < 0.01; ***, P < 0.001, AUC t test. C, Box plot of dasatinib GI50 values (log scale, y-axis) for primary patient-derived cultures separated by trametinib sensitivity status. D, Box plot of trametinib GI50 values (log scale, y-axis) for primary patient-derived cultures separated by dasatinib sensitivity status. **, P < 0.001, t test. E, GSEA enrichment plots for the signature VERHAAK_GLIOBLASTOMA_PRONEURAL in primary patient-derived cultures separated by trametinib (top) or dasatinib (bottom) sensitivity status. The curves show the enrichment score on the y-axis and the rank list metric on the x-axis. Alongside are heat map representations of expression of significantly differentially expressed genes in the signature in all trametinib- or dasatinib-resistant versus sensitive cell cultures. F, GSEA enrichment plots for the signature HALLMARK_EPITHELIAL_ MESENCHYMAL_TRANSITION in primary patient-derived cultures separated by trametinib (top) or dasatinib (bottom) sensitivity status. The curves show the enrichment score on the y-axis and the rank list metric on the x-axis. Alongside are heat map representations of expression of significantly differentially expressed genes in the signature in all trametinib- or dasatinib-resistant versus sensitive cell cultures. G, GSEA enrichment plots for the signature HUANG_DASATINIB_RESISTANCE_UP in primary patient-derived cultures separated by trametinib (top) or dasatinib (bottom) sensitivity status. The curves show the enrichment score on the y-axis and the rank list metric on the x-axis. Alongside are heat map representations of expression of significantly differentially expressed genes in the signature in all trametinib- or dasatinib-resistant versus sensitive cell cultures.

