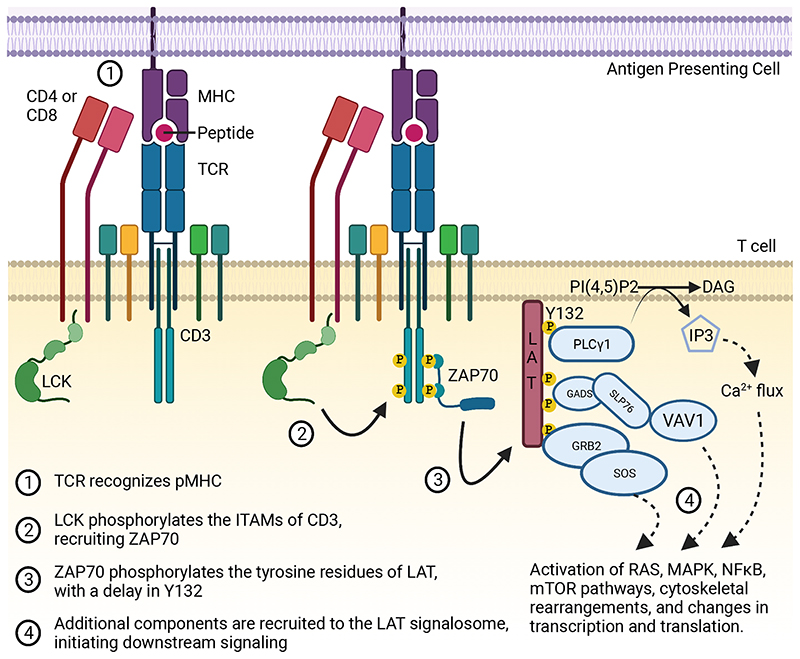
Figure 1. Simplified representation of TCR signaling.
Cartoon depicts a simplified diagram of initial T cell receptor (TCR) signaling with events listed in temporal order. (1) TCR interaction with pMHC. (2) Recruitment of Lck and phosphorylation of ITAMs of CD3 leading to recruitment of ZAP70. (3) Phosphorylation of the LAT signalosome by ZAP70 and (4) activation of multiple downstream signaling pathways. This figure was made using Biorender.

