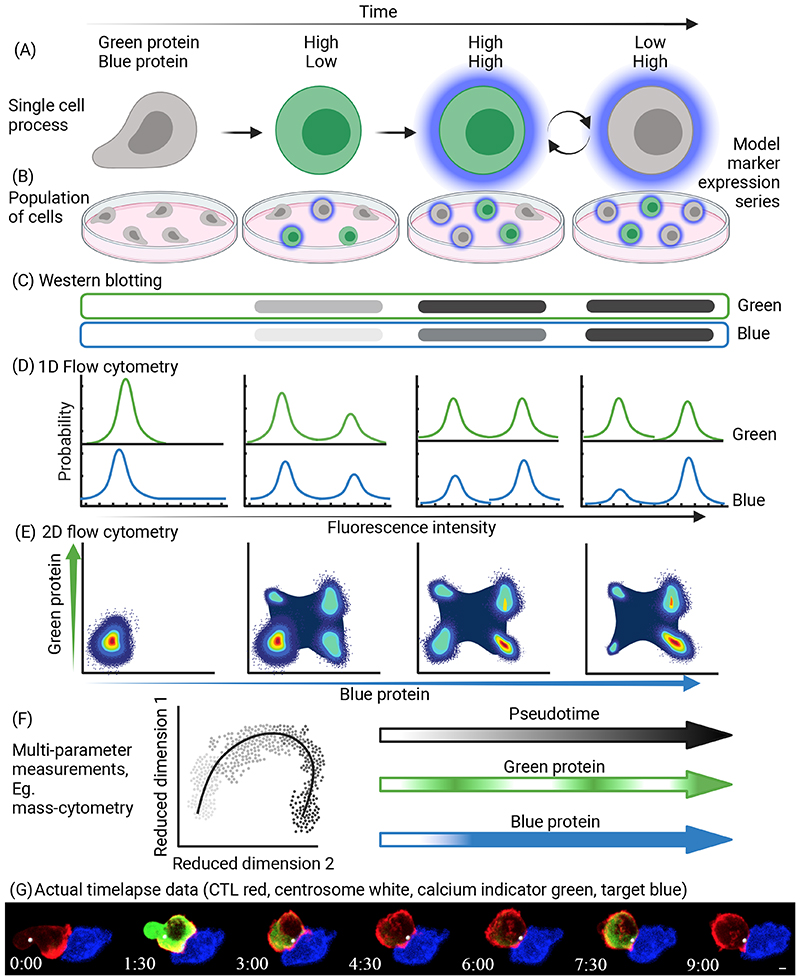
Figure 2. Cell population approaches versus single cell approaches over time.
(A) A schematic representation of a theoretical T cell activation series of events. In this model, during activation the T cell first upregulates Green Protein, then Blue Protein. The expression of Green Protein then oscillates (round arrows) between low and high expression. (B) Model of how expression of these proteins might look by fixed cell imaging. When T cells are activated in a population, all of the states in (A) may be represented and vary with time. (C) Model of how expression of these proteins (Green, top; Blue, bottom) might look by Western blot of pooled cell lysates. (D) Model of how expression of these proteins (Green, top; Blue, bottom) in the population might look by single parameter flow cytometry. (E) Model of how expression of these proteins (Green, y-axis; Blue, x-axis) in the population might look by multi-parameter flow cytometry. (F) Model of how expression of these proteins (Green, right middle; Blue, right bottom) might look following a high dimensional data capture technique such as mass cytometry or single cell RNA sequencing (scRNA-seq) with simultaneous protein measurements. Note that the extra parameters allow inference of a pseudotime trajectory (left and right top) that reveals the different expression dynamics of Blue and Green proteins. However, as it is a pseudotime trajectory constructed from snap-shot measurements, it cannot elucidate precise timescales of expression. Only through continuous time-lapse imaging is the full activation behavior readily apparent. (G) To illustrate the benefits of live imaging in individual cells, we show a time-lapse series of a cytotoxic T lymphocyte (CTL) (red) interacting with an antigen-presenting target cell (blue) captured with a spinning disk confocal microscope. As the CTL interacts with the target cell, a calcium flux is initiated, shown by the oscillating green intensity proportional to the free intracellular calcium, and the centrosome (white sphere) polarizes toward the immune synapse. While calcium may also be measured by alternative approaches, oscillatory behavior in an individual cell requires live imaging. Moreover, organelle movement such as polarization of the centrosome can only be measured through visualization. Scale bar=2μm, Time Min:Sec. This figure was made using Biorender.

