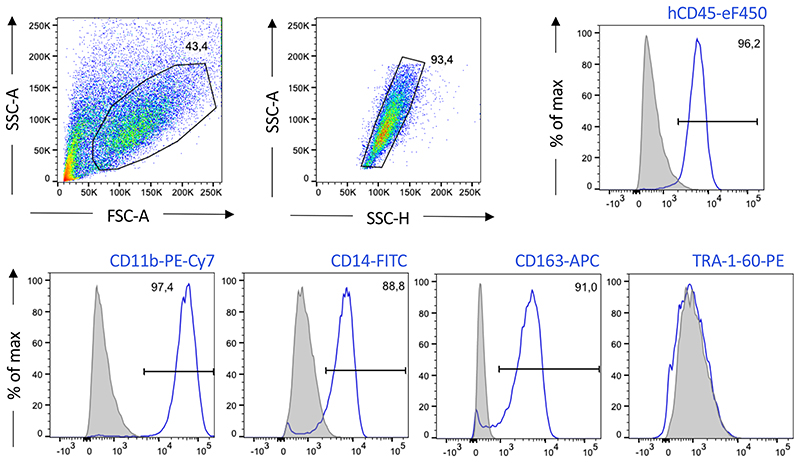
Figure 7. Analysis of iPSC-derived macrophages by flow cytometry (related to BOX 4).
Representative gating strategy for the analysis of iPSC-Mac freshly harvested from the bioreactor by flow cytometry. Pre-gating on viable cells by FSC/SSC properties was followed by a single-cell gating step (SSC-A vs. SSC-H). Subsequently, expression of CD45, CD11b, CD14 and CD163 was analyzed. Grey histograms represent unstained controls (30.056 cells analyzed), blue lines respective surface marker staining (33.799 cells analyzed). Flow cytometry was performed with a Cytoflex S (Beckman Coulter) and data was analyzed using FlowJo (BD Bioscience). Underlying flow cytometry data sets can be accessed under http://flowrepository.org/, Repository IDs: FR-FCM-Z4WE)

