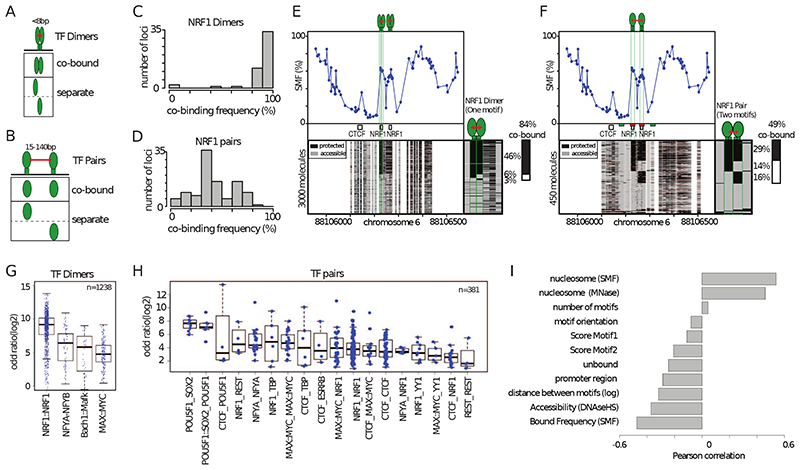
Figure 4. High TF co-occupancy does not rely on a precise motif arrangement.
(A) Footprints for dimeric TFs occur nearby (<8bp) on two halves of the same recognition motif. Schematic representation of the theoretical binding states expected to occur at such motifs, bound by TF dimers. (B) Footprints for neighboring binding sites occurs at separate recognition motifs within the same CRE (<140bp). Schematic representation of the theoretical binding states expected to occur at a pair of neighboring motifs. (C) Histogram depicting the percentage of dimeric co-occupancy at NRF1 motifs. (D) Histogram depicting the percentage of co-occupancy at neighboring pairs of NRF1 motifs. (E, F) Single-locus example of a region bound by NRF1 at two neighboring recognition motifs. Analysis of the degree of TF co-occupancy (E) within the NRF1 dimeric motif and (F) between neighboring motif pairs. Shown are average methylation levels (top panel, blue dots connected by a blue line) and single-molecule stacks measured by targeted amplicon bisulfite sequencing (bottom left), sorted into four states using the co-occupancy classification algorithm (methylated Cs, accessible, light gray; unmethylated Cs, protected, black). The states heatmap (bottom right, binarized heatmap) depicts the occupancy states for each of the protein analyzed in the pairs. The percentages of molecules where individual or co-binding are observed is indicated on the right side of the plot. The fraction of co-bound molecules within all bound molecules is indicated on top of a side bar depicting the co-bound frequency. Collection bins are indicated on x-axis (F) (red: TF bins; green: Flank bins). (G-H) Half motifs are frequently co-bound by TF dimers while motif pairs show highly variable degrees of co-occupancy. Degree of co-occupancy observed at (G) half-motifs bound by TF dimers, and (H) at neighboring motifs bound by TF pairs. Boxplot summarizing the log2 odds ratios of a Fischer’s exact test for each pair of TFs analyzed. Blue dots represent individual TF pairs. (I) Analysis of the determinants of TF co-occupancy. Barplot depicting the Pearson correlation coefficient between the degree of co-occupancy of TF pairs and various genomic features (y axis label). See also Figure S4.

