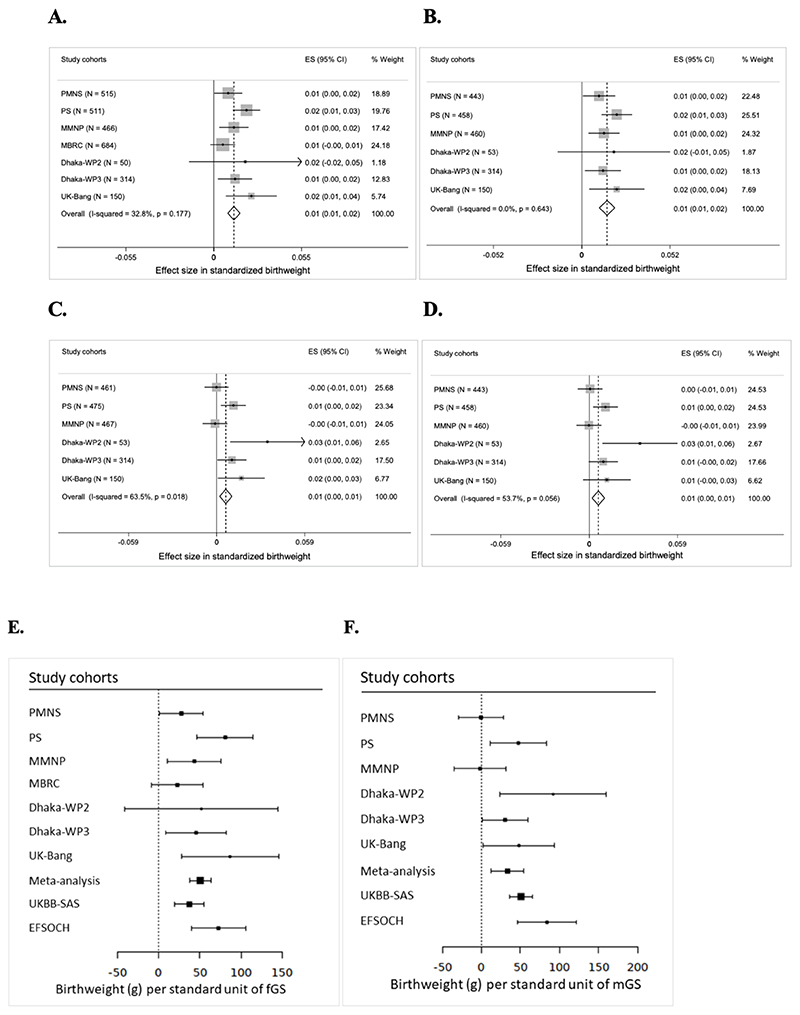
Figure 2. Meta-analysis of associations of fetal genetic score with birthweight in South Asian populations and comparison with European cohorts. Panel A-D: Fetal genetic score with birthweight.
(A) Fetal genetic score adjusted for sex and gestational age; (B) Fetal genetic score adjusted for sex, gestational age and maternal genetic score; (C) Maternal genetic score adjusted for sex and gestational age and (D) Maternal genetic score adjusted for sex, gestational age and fetal genetic score. The X-axis indicates the effect size for standardized birthweight per unit of weighted genetic score. In MMNP, allocation group was additionally adjusted for and in MBRC, only sex was adjusted for, since gestational data was not available for the majority of the samples. Panel E-F: Comparison between South Asians and European cohorts. (E) Weighted fetal genetic score and (F) Weighted maternal genetic score. The X-axis indicates the effect size for birthweight in gram (g) per standardized weighted genetic score. PMNS, Pune Maternal Nutrition Study; PS, Parthenon Study; MBRC, Mysore Birth Records Cohort; MMNP, Mumbai Maternal Nutrition Project; Dhaka-WP2, Work Package 2 of GIFTS; Dhaka- WP3, Work Package 3 of GIFTS; UK-Bang, London UK Bangladeshi cohort; UK Biobank South Asian component (UKBB-SAS); EFSOCH, The Exeter Family Study of Childhood Health; fGS, fetal genetic score; mGS, weighted maternal genetic score; ES, effect size; CI, confidence interval; I2, heterogeneity; p, p- value. Heterogeneity p value for fGS is 0.1777 and for mGS is 0.0046.

