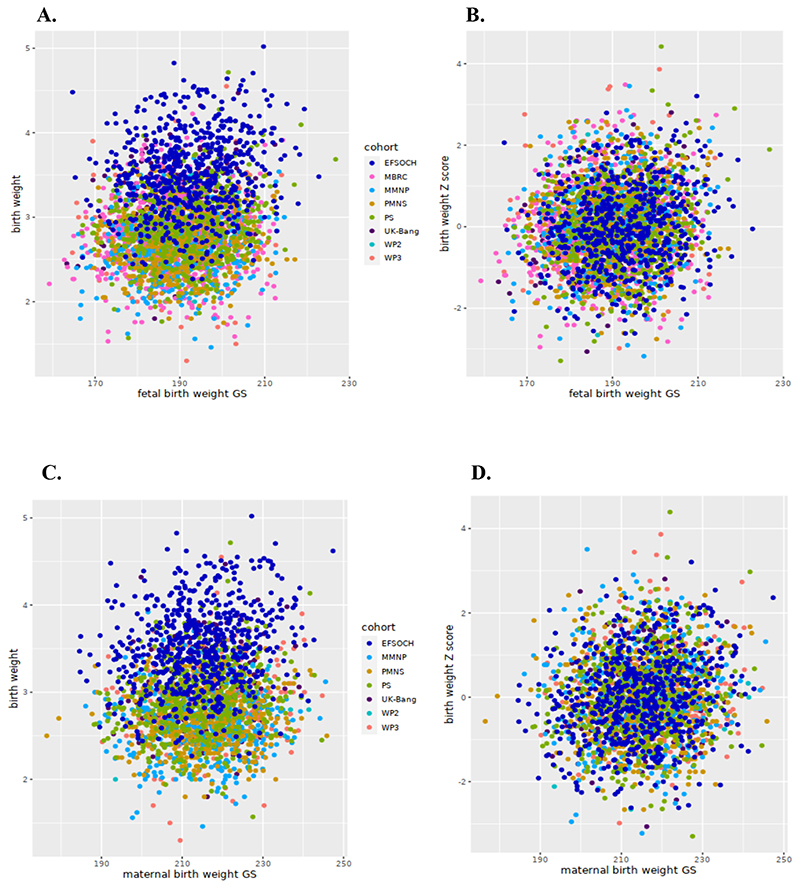
Figure 3. Scatter plot comparing the correlation between birthweight and fetal genetic score and maternal genetic score in South Asian and European cohorts. Panel A-B: birthweight and fetal genetic score (fGS).
A, indicates absolute birthweight and fGS; B, shows the same between cohort-specific birthweight Z-scores and fGS; Panel C-D: birthweight and maternal genetic score (mGS). C, indicates absolute birthweight and mGS and D, shows the same between cohort-specific birthweight Z-scores and mGS.
South Asian cohorts include PMNS, Pune Maternal Nutrition Study; PS, Parthenon Study; MMNP, Mumbai Maternal Nutrition Project; MBRC, Mysore Birth Records Cohort; Dhaka- WP2, Work Package 2 of GIFTS; Dhaka-WP3, Work Package 3 of GIFTS; UK-Bang, London UK Bangladeshi cohort) while EFSOCH (The Exeter Family Study of Childhood Health) is the European Cohort.

