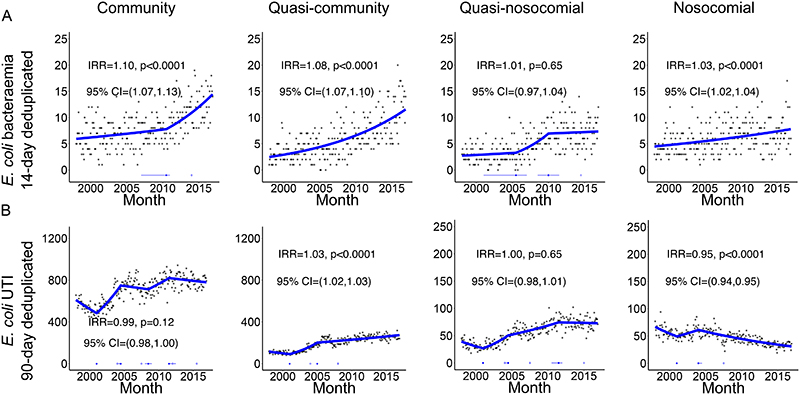
Figure 1. Monthly (A) EC-BSI and (B) EC-UTI according to recent hospital-exposure (first and recurrent infections).
Footnote: only counting EC-BSI recurrences occurring >14 days after an index positive, and EC-UTI recurrences occurring >90 days after an index positive. Thick blue line represents the estimated incidence by iterative sequential regression (ISR). Blue lines at the base of the graph represent 95% CI around the breakpoints estimated by the ISR model. IRR=annual incidence rate ratio in 2016, that is the relative increase in rate per year as estimated in 2016.

