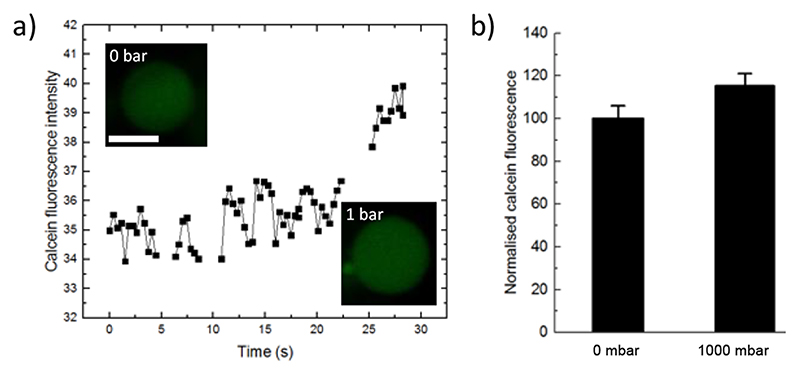
Figure 4. Permeation assay.
a) Plot of the internal calcein fluorescence intensity of an exemplary GUV as it is compressed by the stamp (1000 mbar). Note that gaps in the data are when the GUV had to be re-centred in relation to the objective focal plane. Inserts show confocal images before and after compression. Scale bar: 5 μm. b) The average calcein fluorescence was measured before and 3 min after compression (n=6), and mean intensity increase was 15.3 ± 5.8 %. Error bars are taken from the standard deviations.

