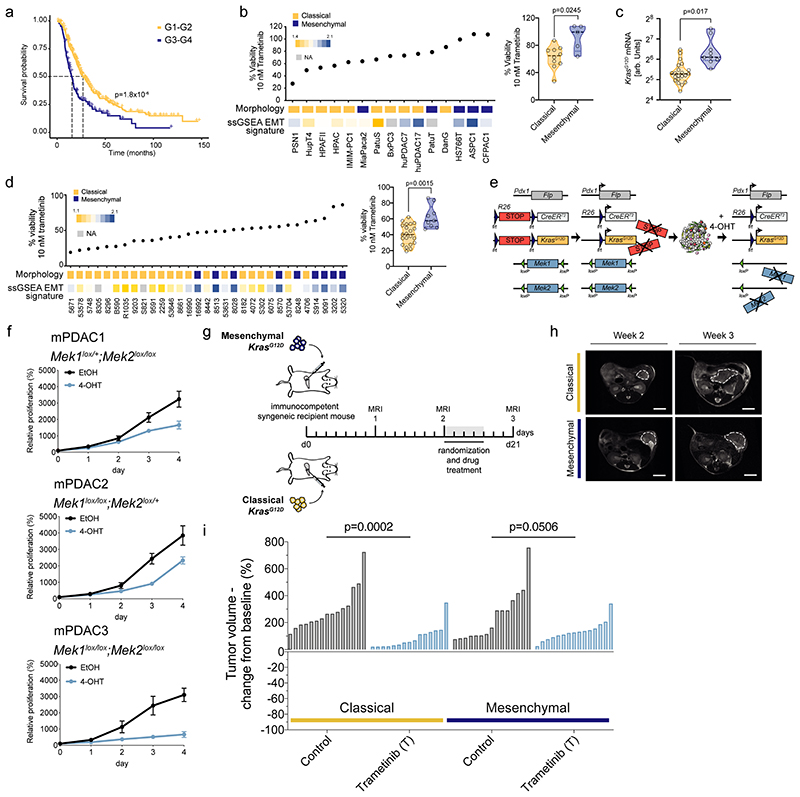
Figure 1. Resistance to MEK inhibition in vitro and in vivo .
a, Kaplan–Meier analysis comparing survival of surgically resected patients having either G1/G2 or G3/G4 tumor grading. We combined data from 6–8 .
b, Left, Percentage of cell viability at 10 nM trametinib in hPDAC cell lines. Cell morphology and single sample gene set enrichment analysis (ssGSEA) EMT signature are integrated below. Cells showing a classical phenotype are marked in yellow, those presenting a mesenchymal phenotype in blue. huPDAC17 and huPDAC7 are primary human patient derived PDAC cell cultures generated from PDX models in our laboratory 58 . Right, Violin plots comparing the percentage of cell viability at 10 nM trametinib between classical and mesenchymal hPDAC cell cultures.
c, Allele-specific KrasG12D mRNA expression in classical (n=21 mice) and mesenchymal (n=9 mice) tumors by combining amplicon-based RNA-seq and qRT-PCR.
d, Left, Percentage of cell viability at 10 nM trametinib in mPDAC cell cultures. Cell morphology and ssGSEA EMT signature are integrated below. Right, Comparison of the percentage of cell viability at 10 nM trametinib between classical and mesenchymal mPDAC cell cultures.
e, Schematic representation of the dual-recombinase system to inducible delete floxed Mek1 and Mek2 in established tumors using a tamoxifen activatable CreERT2 allele.
f, Viability assay of hydroxytamoxifen (4-OHT)-treated Mek1lox/+;Mek2lox/lox (mPDAC1), Mek1lox/lox;Mek2loxl+ (mPDAC2), Mek1lox/lox;Mek2lox/lox (mPDAC3) cell cultures compared to vehicle (ethanol, EtOH). Data are shown as mean ±SD; n=3 independent experiments.
g, Schematic representation of the experimental set up to test treatment efficacy of trametinib in vivo using subtype-specific models. Mesenchymal (9091) and classical (8661) mPDAC cells were used for the orthotopic transplantation experiments.
h, Representative magnetic resonance imaging (MRI) of trametinib treated mice before (week 2) and after one week of treatment (week 3). Scale bar, 5mm.
i, Waterfall plot of the fold change in tumor volume compared to baseline (determined by MRI-based volumetric measurements) of orthotopically transplanted classical and mesenchymal tumors after one week of trametinib treatment.
P values in (b, right), (c), (d, right) and (i) were calculated by two-tailed unpaired t test. P value in (a) was calculated with log-rank (Mantel-Cox) test.

