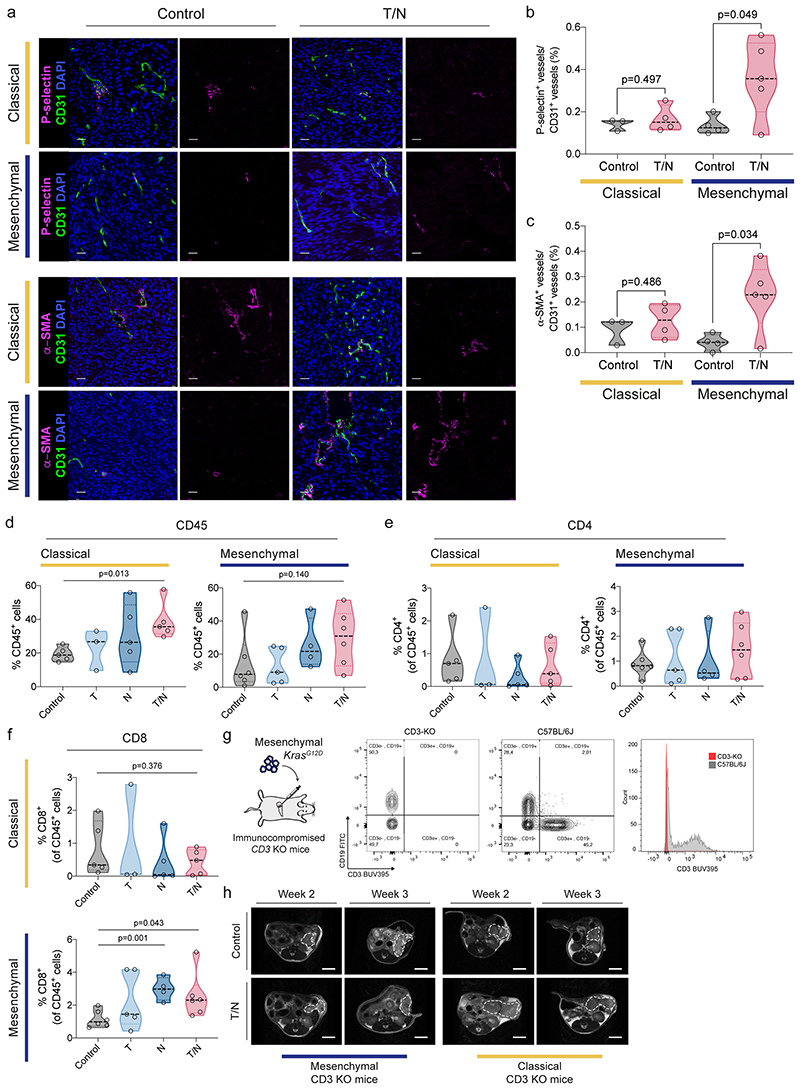
Extended Data Fig. 7. Characterization of context-specific changes of the tumor vasculature and the adaptive immune system in classical and mesenchymal PDAC subtypes upon therapy.
a, Orthotopically transplanted tumors of the indicated subtypes were treated with vehicle (control) and the T/N combination. Representative images of immunofluorescence stainings of tissue sections for P-selectin (upper panel) and α-SMA (lower panel) (magenta). CD31 was used to detect endothelial cells (green). DAPI was used for nuclear staining (blue). Scale bars, 25 µm.
b, c, Quantification of the P-selectin+ vessels (b) and α-SMA+ vessels (c) of the immunofluorescence stainings depicted in (a). Individual tumors are shown as single dots in the graph (classical: control n=3, T/N n=4; mesenchymal: control n=4, T/N n=5).
d, Orthotopically transplanted tumors of the indicated subtypes were treated with vehicle (control) and the indicated drugs and drug combinations, explanted, single cell suspended and analyzed by flow cytometry. Panel (d) shows the staining for CD45+ cells. Individual tumors are shown as single points in the graph.
e, f, Graphs representing the percentage of CD4+ (e) and CD8+ (f) cells in the PDAC control cohort and in the different treatment conditions as analyzed by flow cytometry. Single points represent individual tumors.
g, Left, scheme of the in vivo experimental strategy using orthotopic PDAC cell transplantations into T cell deficient CD3ε knockout (KO) mice. Right, representative FACS plot of immunodeficient CD3ε-KO and wild-type C57BL/6 mice, highlighting the lack of T cells in the CD3ε-KO animals.
h, Representative MRI picture of vehicle (control) and T/N treated PDAC bearing CD3ε-KO mice before (week 2) and after 1 week treatment (week 3).
P values in (b), (c), (d) and (f) were calculated with two-tailed unpaired t test.
T: trametinib, N: nintedanib, T/N: trametinib+nintedanib.

