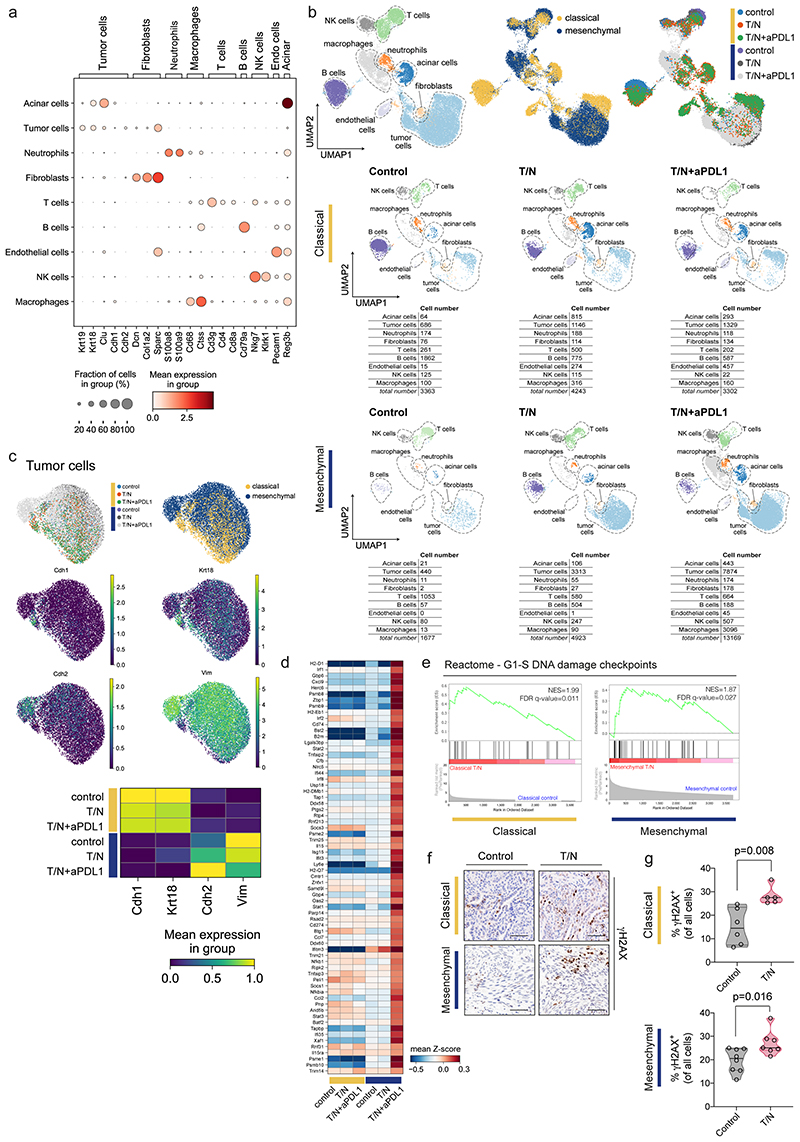
Extended Data Fig. 9. scRNA-seq reveals treatment-induced changes in TME cell subpopulations and activation of the DNA damage pathway in cancer cells.
a, Dotplot displaying marker gene expression across each identified cluster of cancer cells and corresponding tumor microenvironment for both classical and mesenchymal tumors. The clusters are indicated on the y axis and the main markers for each identified population are indicated on the x axis.
b, Left, UMAP plot showing all identified cell populations within the scRNA-seq experiment. Middle, UMAP plot showing classical (yellow) and mesenchymal (blue) tumors from all treatment and vehicle groups. Right, UMAP plot showing the treatment induced changes in cell type composition among the identified cell populations across subtypes. Lower part, UMAP density plots showing distribution of annotated clusters upon treatment, cell numbers for each condition are integrated below.
c, UMAP plot showing the identified tumor cell clusters. The expression of Cdh1 and Krt18, epithelial markers, and of Cdh2 and Vim, mesenchymal markers, across treatment conditions are shown below.
d, Heatmap of the most differentially expressed genes from the gene expression signature in figure 7 across subtypes and treatment conditions.
e, Gene set enrichment analysis (GSEA) of scRNA-seq data of cancer cells reveals enrichment of DNA damage in both classical and mesenchymal tumors upon treatment with the T/N combination. NES and FDR-q values are indicated.
f, Representative images of immunohistochemical staining for γH2AX of control and T/N treated tumor sections for both classical and mesenchymal subtypes. Scale bar, 70 µm.
g, Quantification of γH2AX positive cells in (f). Individual tumors are shown as single points in the graph (classical: control n=6, T/N n=5; mesenchymal: control n=8, T/N n=7). P values were calculated with two-tailed unpaired t test.
Endo cells: endothelial cells. T/N: trametinib+nintedanib. T/N+aPD-L1: trametinib+nintedanib+anti PD-L1 antibody.

