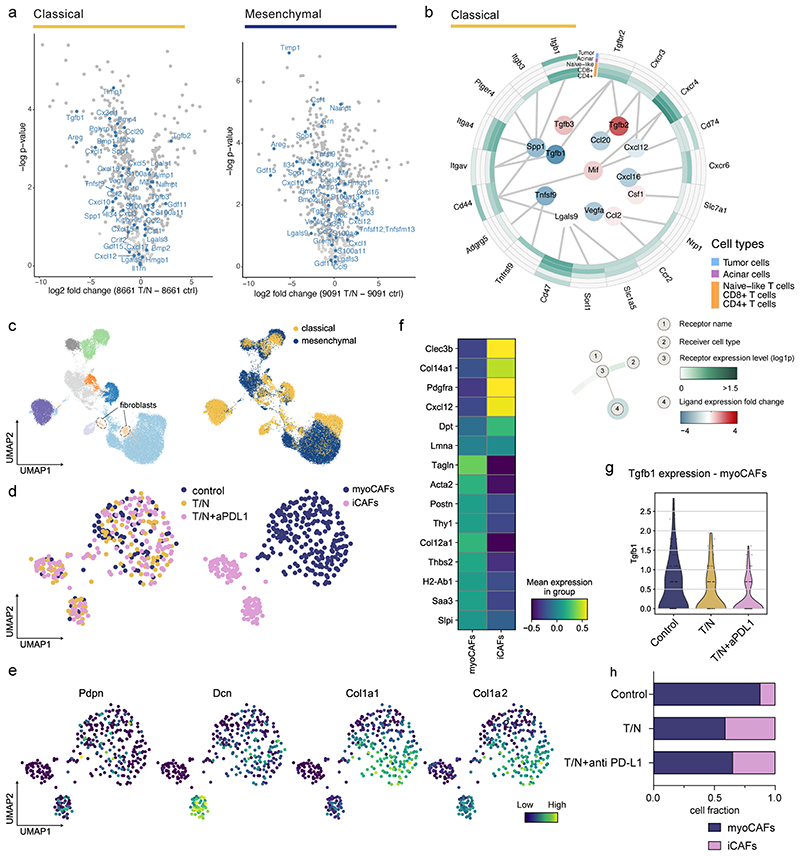
Extended Data Fig. 10. Context-dependent reprogramming of the cancer cell derived secretome and cancer associated fibroblasts (CAFs) by the T/N combination therapy.
a, Volcano plots highlighting the changes in secreted factors upon T/N treatment in classical (left) and mesenchymal (right) PDAC cells. The x-axis shows log2 fold change (treated/control), the y-axis the per test adjusted p values, which were calculated by differential expression test (two-sided t test).
b, Circos plot showing the key communication signals from tumor cells to T cell subtypes, tumor cells and acinar cells in classical mPDAC. The ligand protein expression fold change, identified from secretome experiments, between T/N and control is shown in the middle. Normalized receptor expression levels obtained from scRNA-seq data are shown in the outer concentric circles.
c, UMAP plot highlighting the whole population of CAF cells identified in classical and mesenchymal tumors.
d, Left, UMAP plot showing the CAF population across different treatment conditions in classical tumors. Right, UMAP plots displaying the identified CAF clusters and resulting subpopulations for classical tumors.
e, UMAP plots of the CAF cluster displaying selected marker gene expression.
f, Heatmap displaying expression of selected genes in CAFs across the identified clusters. The y axis shows the selected marker genes, the x axis represents each of the identified clusters in (d).
g, Violin plot showing Tgfb1 expression by myoCAFs across the different treatment conditions.
h, Proportion of CAF subtypes in the indicated different treatment conditions. CAF subpopulations were identified in the fibroblast cell clusters and annotated with the markers described in (f).
T/N: trametinib+nintedanib, T/N+aPD-L1: trametinib+nintedanib+anti PD-L1 antibody.

