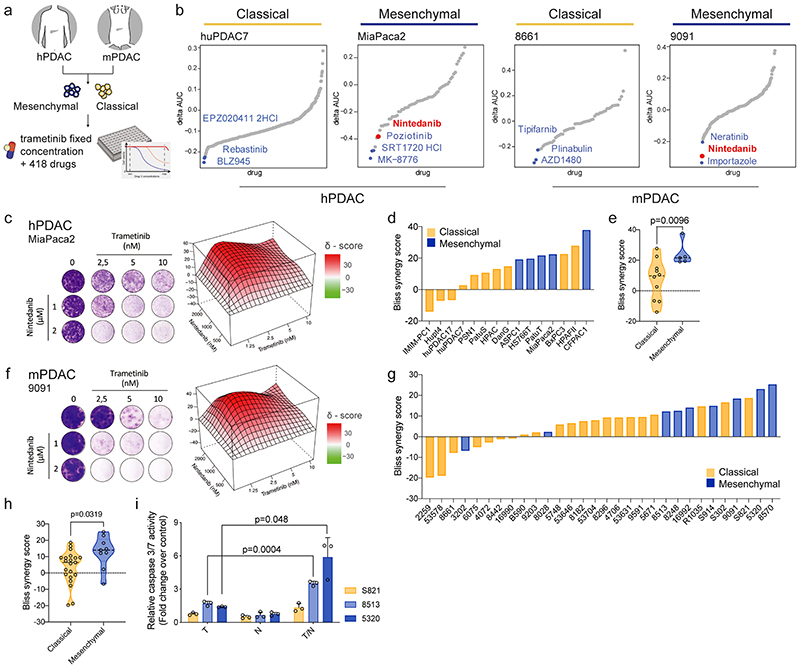
Figure 2. Systematic combinatorial drug screens identify novel therapies for non-glandular mesenchymal PDAC.
a, Experimental set up of the high-throughput drug screen.
b, Combinatorial drug screen on two mPDAC (9091, 8661) and two hPDAC cell cultures (MiaPaca2, huPDAC7).
c, f Clonogenic assay and synergy map of representative hPDAC (c) and mPDAC (f) cultures treated with the indicated concentrations of trametinib and nintedanib.
d, g, Bliss synergy scores integrated with cell morphology for hPDAC (d) and mPDAC (g) cell cultures (classical subtype in yellow, mesenchymal in blue).
e, h, Comparison of the Bliss synergy scores, from panels (d) and (g), between classical and mesenchymal hPDAC (e) and mPDAC (h) cells.
i, Induction of caspase 3/7 activity upon treatment with trametinib (10 nM), nintedanib (2 μM) or the combination of both for 24 hours relative to the vehicle treated control. Data are shown as mean ±SD; n=3 independent experiments.
P values in (e), (h) and (i) were calculated by two-tailed unpaired t test.
T: trametinib, N: nintedanib, T/N: trametinib+nintedanib.

