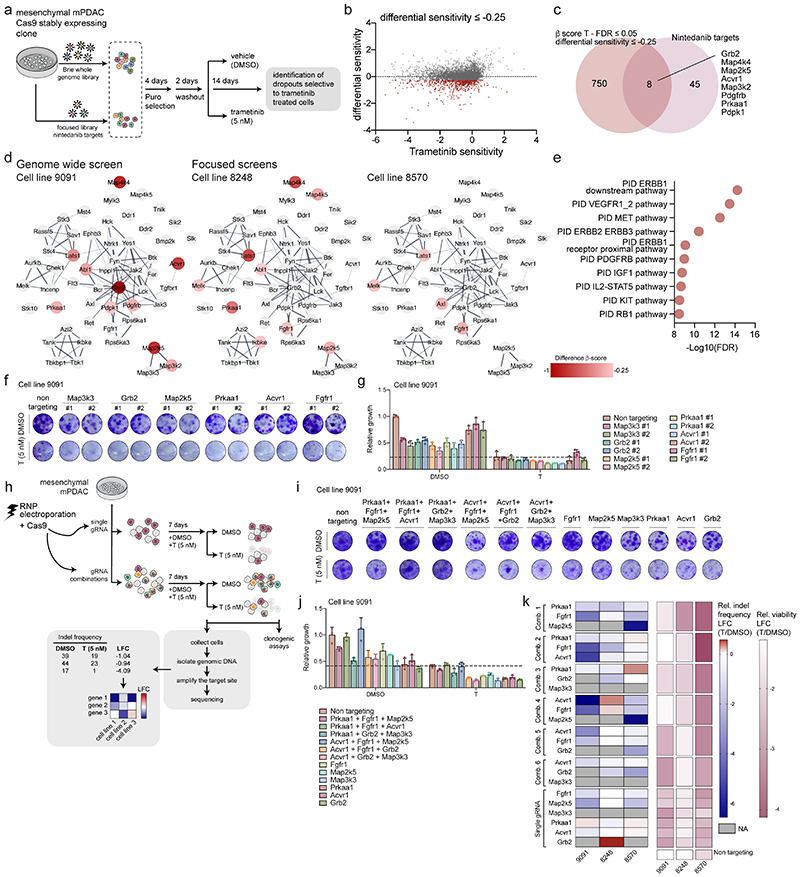
Figure 3. Genetic-screens uncover nintedanib targets that sensitize mesenchymal PDAC towards trametinib.
a, Schematic representation of genome-scale and nintedanib-target focused CRISPR/Cas9 screens.
b, Genome-scale screen in mesenchymal mPDAC 9091 cells. Trametinib sensitivity (x-axis) represents β-scores calculated as sgRNA representation difference between trametinib-treated cells and their initial representation. Differential sensitivity (y-axis) indicates β-score differences between trametinib- and DMSO-treated arms. In red, genes presenting differential sensitivity ≤-0.25.
c, Venn-diagram of overlap of genome-wide screening hits (b) (differential sensitivity ≤-0.25 and FDR ≤0.05) and the nintedanib targets.
d, Network of nintedanib targets of CRISPR/Cas9 screens in 9091 (genome-wide), 8248 and 8570 (focused) cells built on the string database and visualized using Cytoscape. Nintedanib targets are color-coded according to the differential sensitivity between trametinib- and DMSO-treated arms.
e, Pathway enrichment within the MSigDB canonical-pathways database of genomewide screening hits of (b) showing a differential sensitivity ≤-0.25.
f, Lentiviral CRISPR/Cas9-mediated deletion of selected top-scoring nintedanib targets in 9091 cells. Knock-out cells were treated with trametinib (5 nM) or DMSO and viability was assessed through clonogenic assays.
g, Quantification of panel (f). Data are normalized to DMSO-treated non-targeting controls (mean ±SD; n=3 biological replicates). The dashed line represents the mean of trametinib-treated non-targeting controls.
h, Combinatorial deletion of nintedanib targets via ribonucleoprotein (RNP) electroporation. Mesenchymal mPDAC cells 9091, 8248 and 8570 were electroporated to deliver the Cas9-sgRNA complex. The resulting cells were treated for 7-9 days with DMSO or trametinib (5 nM). Cell viability was assessed via clonogenic assays (panel i,j and extended data fig. 6) and indel frequencies via sequencing (panel k). The indels were used to determine the log2-fold-change (LFC) of the indel frequency in panel (k).
i, Clonogenic assays of 9091 cells electroporated with RNPs targeting the indicated nintedanib targets. Knock-out cells were treated with trametinib (5 nM) or DMSO.
j, Quantification of panel (i). Data are normalized to DMSO-treated non-targeting controls (mean ±SD; n=3 biological replicates). Dashed line represents the mean of trametinib-treated non-targeting controls.
k, Left, Heatmap of the indel frequencies LFC (trametinib/DMSO) as described in (h). Right, Heatmap of relative viability (trametinib/DMSO) of the clonogenic experiments described in (i,j).

