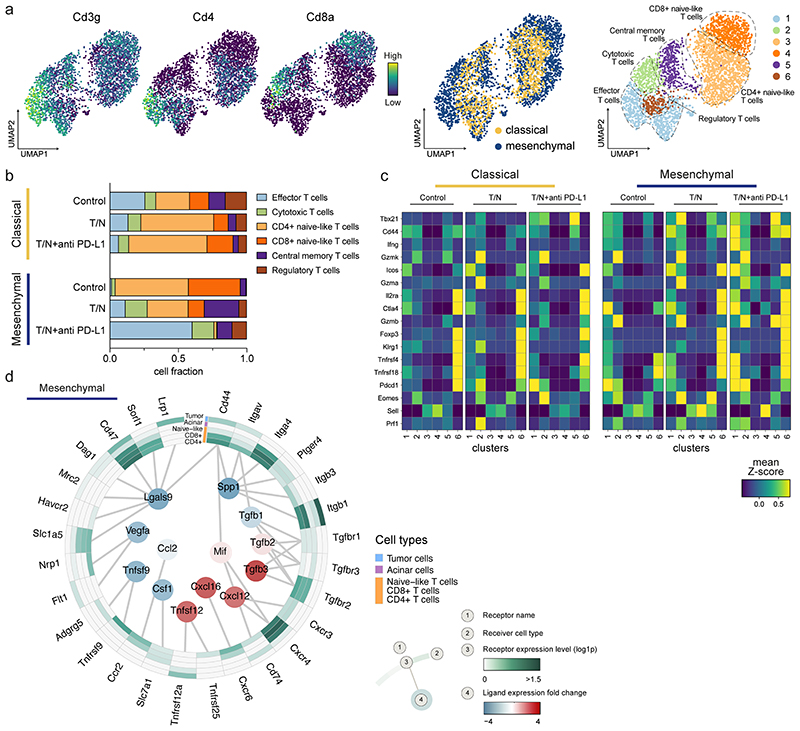
Figure 8. The combinatorial therapy induces a T cell mediated anti-tumor immune response in mesenchymal PDAC.
a, Left, UMAP plots displaying Cd3g, Cd4 and Cd8a marker gene expression across the whole population of T cells identified by scRNA-seq in classical and mesenchymal tumors. Center, UMAP plots of classical (yellow) and mesenchymal (blue) T cells from all treatment and vehicle groups are highlighted. Right, UMAP plots showing the six T cell subpopulations identified by scRNA-seq.
b, Proportion of cells divided by treatment condition and PDAC subtype as identified by scRNA-seq analysis of the T cell clusters annotated in (a).
c, Heatmap displaying expression of selected genes across the identified T cell clusters (1-6) for both classical and mesenchymal tumors. The different treatment conditions are shown separately.
d, Circos plot showing the key communication signals from tumor cells to T cell subpopulations, tumor cells and acinar cells in mesenchymal mPDAC. The ligand protein expression fold-change, identified from secretome experiments, between T/N and control is shown in the middle. Normalized receptor expression levels obtained from scRNA-seq data are shown in the outer concentric circles.
T/N: trametinib+nintedanib, T/N+anti PD-L1: trametinib+nintedanib+anti PD-L1 antibody.

