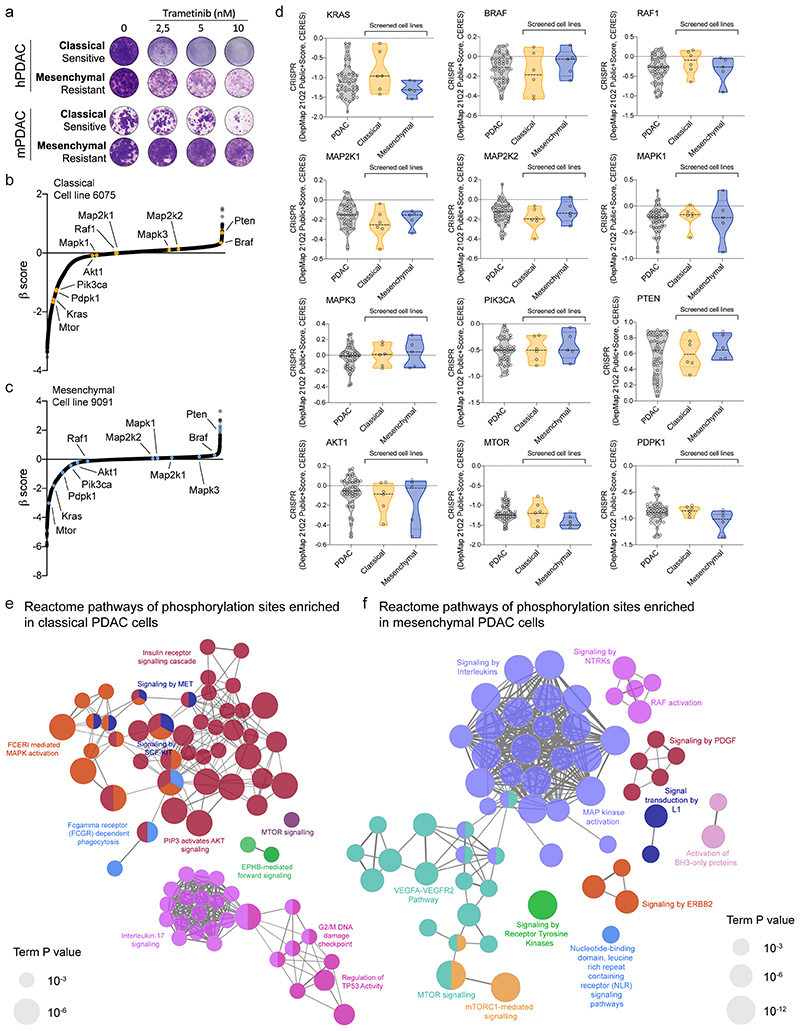
Extended Data Fig. 1. Assessment of differential pharmacologic and genetic dependencies and signaling pathway activities in PDAC subtypes.
a, Clonogenic assay of two hPDAC cell lines (top) and two mPDAC cell cultures (bottom) treated with the MEK inhibitor trametinib. The shown cell lines represent the drug-response of the epithelial and mesenchymal subtypes to trametinib treatment.
b, c, β-score distribution of CRISPR/Cas9 genome wide negative-selection (viability) screens performed in one classical (6075, panel (b)) and one mesenchymal (9091, panel (c)) mPDAC cell line. Highlighted in yellow, for the classical line, and blue, for the mesenchymal line, are the β-scores of KRAS and the core genes involved in direct KRAS downstream signaling.
d, CRISPR/Cas9 dependency scores of KRAS and core genes involved in direct KRAS downstream signaling. The dependency scores of all hPDAC cell lines were obtained from the DepMap database and are shown in grey. Dependency scores corresponding to classical and mesenchymal cell lines included in the T/N drug screen are represented in the yellow and blue violin plots. Data were obtained from the CRISPR dataset and analyzed through the DepMap release DepMap 21Q2 Public (https://depmap.org/portal/download/).
e, f, Mesenchymal (9091) and classical (8661) PDAC cell cultures were used to generate site-specific phospho-array datasets (Phospho Explorer antibody microarray, Full Moon Biosystems). Phospho-array data (supplementary table 1) were used to test for the enrichment of differentially phosphorylated sites between classical and mesenchymal mPDAC cell lines. Functionally grouped networks with reactome terms as nodes, showing pathways overrepresented in classical (e) and mesenchymal (f) cells are represented with the ClueGO plugin of Cytoscape. Only the pathways with an adjusted p value (calculated by two-sided hypergeometric test, Bonferroni corrected) ≤ 0.05 are depicted. The node size represents the term enrichment significance.

