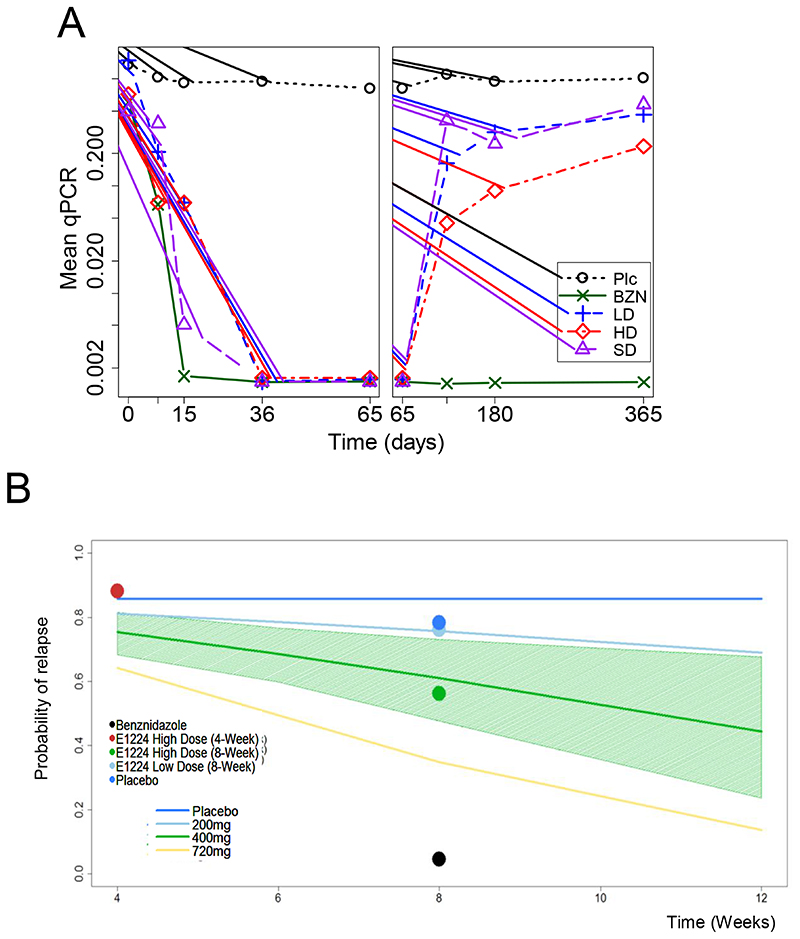
Figure 2.
(A) Sequential quantitative PCR measurements. The mean of qPCR-Based responses was derived during the treatment phase (left panel) and over time up to 12 months post-treatment (right panel). Plc=Placebo. (B) PKPD model of predicted probability of relapse. The continuous lines in the graph are model predictions of the probability of relapse using E1224 at different treatment regimens. For clarity reasons, the 95% CI (shaded area) for these predictions is only shown for the E1224 High Dose cohort. Circles represent the observed population of patients with relapse.

