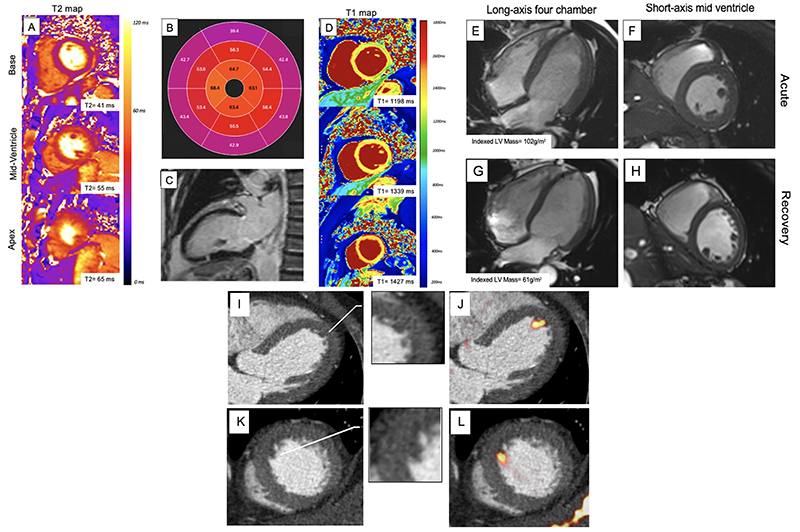
Figure 2. Cardiac Magnetic Resonance Imaging and Computed Tomography Findings in Takotsubo Syndrome.
Short axis T2 maps (A), T2 polar map (B) and short-axis T1 maps (D), demonstrating elevated T2 and T1 values circumferentially in the mid and apical regions (outside of a coronary territory). Long axis two-chamber view demonstrating transmural fibrotic band pattern typical of takotsubo syndrome 4 months after the index event (C). Long axis four-chamber and short axis views of mid-ventricle demonstrating elevated left ventricular mass in acute phase (E, F) and normalization during convalescence (G, H). Hybrid positive emission tomography with cardiac computed tomography angiography depicting a small left ventricular thrombus in a patient with takotsubo syndrome with no clinically apparent thrombus on conventional imaging. There is subtle hypoattenuation on the computed tomography angiogram (magnified inserts) and increased uptake of an activated platelet and thrombus-specific radiotracer (18F-GP-1; yellow-red) in long axis four-chamber (I, J) and short axis (K, L) views on positron emission tomography.

