. 2022 Feb 14;10(4):498–511. doi: 10.1158/2326-6066.CIR-21-0853

Figure 1.

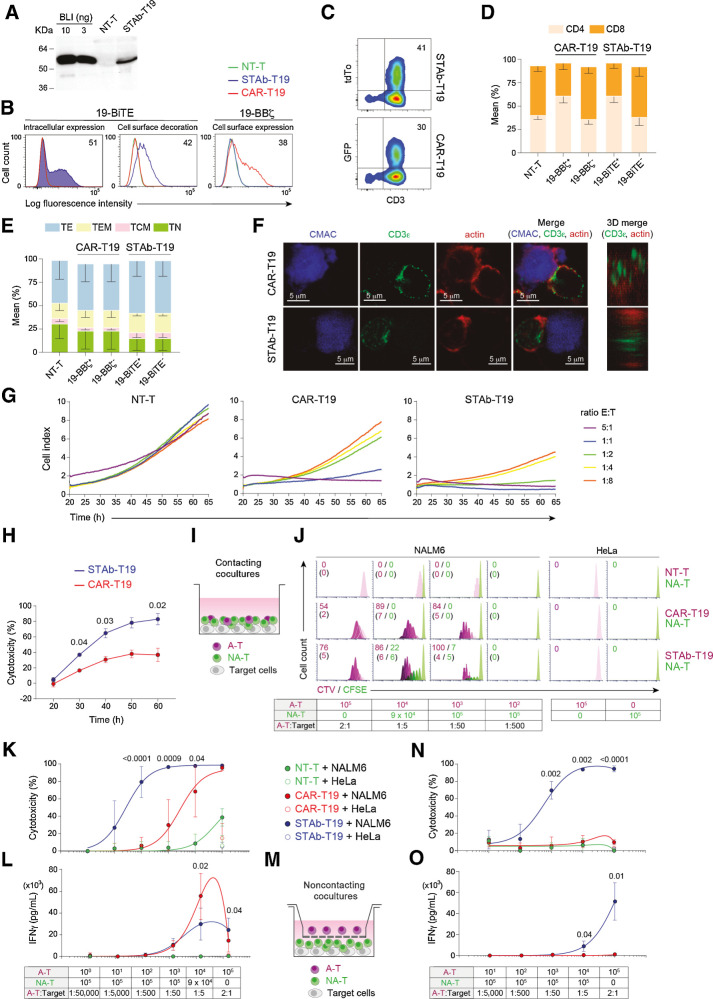
Figure 1. Comparative in vitro study of engineered STAb-T19 and CAR-T19 cells. A, Western blot detection of secreted 19-BiTE in the conditioned media from lentivirus-transduced human primary T cells (STAb-T19). Conditioned media from nontransduced T cells (NT-T) and media containing blinatumomab (BLI) were used as negative and positive controls, respectively. One representative experiment of three is shown. B, Representative analysis of intracellular and cell surface–bound 19-BiTE (decoration), and cell surface–expressed 19-CAR in NT-T and engineered CAR-T19 and STAb-T19 cells by flow cytometry. One representative experiment out of three independent experiments is shown. The numbers represent the percentage of cells staining positive for the indicated marker. C, Percentage of reporter protein expression in STAb-T19 cells (tdTo) and CAR-T19 cells (GFP). One representative transduction out of three performed is shown. D and E, Percentage of CD4+ and CD8+ T cells (D) and naïve (TN), central memory (TCM), effector memory (TEM), and effector (TE) T cells (E) among NT-T, CAR-T19, or STAb-T19 cells 7 days after transduction (means ± SD of three independent experiments are shown). F, Representative images of immunologic synapse (IS) assembly by primary CAR-T19 and STAb-T19 cells stimulated for 15 minutes with CMAC (blue)-labeled CD19+ cells, stained for CD3ε and actin at the mature IS, with IS topology obtained from 3D reconstructions of regions of interest in confocal stacks. G and H, Real-time cell cytotoxicity assay with HEK-293CD19 target cells cocultured with NT-T, CAR-T19, or STAb-T19 cells at the indicated E:T ratios, and cell index values determined every 15 minutes for 65 hours using an impedance-based method (G) and percentage lysis normalized to NT-T cells (E:T ratio = 0.5:1; H), presented from one representative experiment performed in duplicate. I, Schematic representation of the direct contact coculture system used to study the ability of secreted 19-BiTE to induce bystander T-cell proliferation. J, Bystander T-cell proliferation after 5 days of coculture, with percentage of dividing cells and the number of cell divisions in parentheses. The total E:T ratio was constant (2:1), but the ratios A-T:target and A-T:NA-T varied as indicated. One representative experiment from three independent experiments is shown. K, Cytotoxicity induced by varying numbers of A-T and NA-T cells from the same donor cocultured with NALM6Luc or HeLaLuc target cells for 48 hours, maintaining a constant 2:1 E:T ratio, measured by adding D-luciferin to detect bioluminescence. Data are shown as mean ± SD from four replicates. Significance was calculated by an unpaired Student t test. L, IFNγ secretion was determined by ELISA. Data are mean ± SD of three independent experiments. Significance was calculated by an unpaired Student t test. M, Cocultures were performed in a noncontacting transwell system; NALM6Luc or HeLaLuc target cells and NA-T cells were plated in the bottom well and A-T cells (NT-T, CAR-T19, or STAb-T19) in the insert well. N and O, After 48 hours, the percentage of cytotoxicity (N) was determined by luciferase assay, and IFNγ secretion (O) was determined by ELISA. Data are shown as mean ± SD from three and four replicates, respectively. Significance was calculated by an unpaired Student t test.

Comparative in vitro study of engineered STAb-T19 and CAR-T19 cells. A, Western blot detection of secreted 19-BiTE in the conditioned media from lentivirus-transduced human primary T cells (STAb-T19). Conditioned media from nontransduced T cells (NT-T) and media containing blinatumomab (BLI) were used as negative and positive controls, respectively. One representative experiment of three is shown. B, Representative analysis of intracellular and cell surface–bound 19-BiTE (decoration), and cell surface–expressed 19-CAR in NT-T and engineered CAR-T19 and STAb-T19 cells by flow cytometry. One representative experiment out of three independent experiments is shown. The numbers represent the percentage of cells staining positive for the indicated marker. C, Percentage of reporter protein expression in STAb-T19 cells (tdTo) and CAR-T19 cells (GFP). One representative transduction out of three performed is shown. D and E, Percentage of CD4+ and CD8+ T cells (D) and naïve (TN), central memory (TCM), effector memory (TEM), and effector (TE) T cells (E) among NT-T, CAR-T19, or STAb-T19 cells 7 days after transduction (means ± SD of three independent experiments are shown). F, Representative images of immunologic synapse (IS) assembly by primary CAR-T19 and STAb-T19 cells stimulated for 15 minutes with CMAC (blue)-labeled CD19+ cells, stained for CD3ε and actin at the mature IS, with IS topology obtained from 3D reconstructions of regions of interest in confocal stacks. G and H, Real-time cell cytotoxicity assay with HEK-293CD19 target cells cocultured with NT-T, CAR-T19, or STAb-T19 cells at the indicated E:T ratios, and cell index values determined every 15 minutes for 65 hours using an impedance-based method (G) and percentage lysis normalized to NT-T cells (E:T ratio = 0.5:1; H), presented from one representative experiment performed in duplicate. I, Schematic representation of the direct contact coculture system used to study the ability of secreted 19-BiTE to induce bystander T-cell proliferation. J, Bystander T-cell proliferation after 5 days of coculture, with percentage of dividing cells and the number of cell divisions in parentheses. The total E:T ratio was constant (2:1), but the ratios A-T:target and A-T:NA-T varied as indicated. One representative experiment from three independent experiments is shown. K, Cytotoxicity induced by varying numbers of A-T and NA-T cells from the same donor cocultured with NALM6Luc or HeLaLuc target cells for 48 hours, maintaining a constant 2:1 E:T ratio, measured by adding D-luciferin to detect bioluminescence. Data are shown as mean ± SD from four replicates. Significance was calculated by an unpaired Student t test. L, IFNγ secretion was determined by ELISA. Data are mean ± SD of three independent experiments. Significance was calculated by an unpaired Student t test. M, Cocultures were performed in a noncontacting transwell system; NALM6Luc or HeLaLuc target cells and NA-T cells were plated in the bottom well and A-T cells (NT-T, CAR-T19, or STAb-T19) in the insert well. N and O, After 48 hours, the percentage of cytotoxicity (N) was determined by luciferase assay, and IFNγ secretion (O) was determined by ELISA. Data are shown as mean ± SD from three and four replicates, respectively. Significance was calculated by an unpaired Student t test.