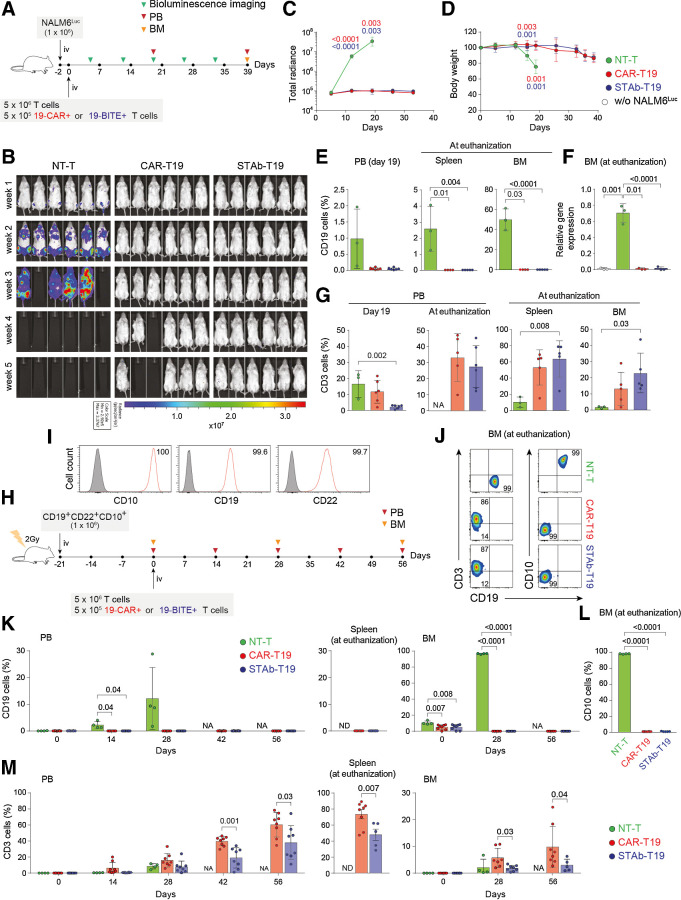
Figure 4.
In vivo antitumor efficacy of STAb-T19 cells. A, Timeline of cell line–derived xenograft murine model of NSG mice (n = 6/group) receiving i.v. NALM6Luc cells followed by NT-T, CAR-T19, or STAb-T19 cells. B, Bioluminescence images showing disease progression. C, Total radiance quantification at the indicated time points. D, Change in body weight over time. E, Detection by FACS of B-ALL cells (CD19+) cells in PB at day 19, and in spleen and BM at euthanization. F, Relative mRNA expression of CD19 in BM at euthanization. G, T-cell (CD3+) persistence in PB at days 19 and 39, and in spleen and BM at euthanization. Data are shown as mean ± SD. H, Timeline of PDX murine model of NSG mice receiving i.v. CD19+ CD22+ CD10+ B-ALL blasts followed NT-T (n = 4), CAR-T19 (n = 8), or STAb-T19 (n = 8) cells. I, CD10, CD19, and CD22 expression in primary human B-ALL cells with the percentage of positive cells. J, Representative dot plots showing human T cells and B-ALL cells in BM of mice at day 56 after infusion. K, Percentage of CD19+ leukemic cells in PB, spleen, and BM at indicated time points. L, Percentage of CD10+ leukemic cells in BM at euthanization. M, Human T-cell persistence over time in PB, spleen, and BM at the indicated time points. Data are shown as mean ± SD; each dot represents an independent mouse. Significance was calculated by an unpaired Student t test. NA, not applicable; ND, not determined.

