. 2021 Jul 19;11(12):3158–3177. doi: 10.1158/2159-8290.CD-21-0209

Figure 2.

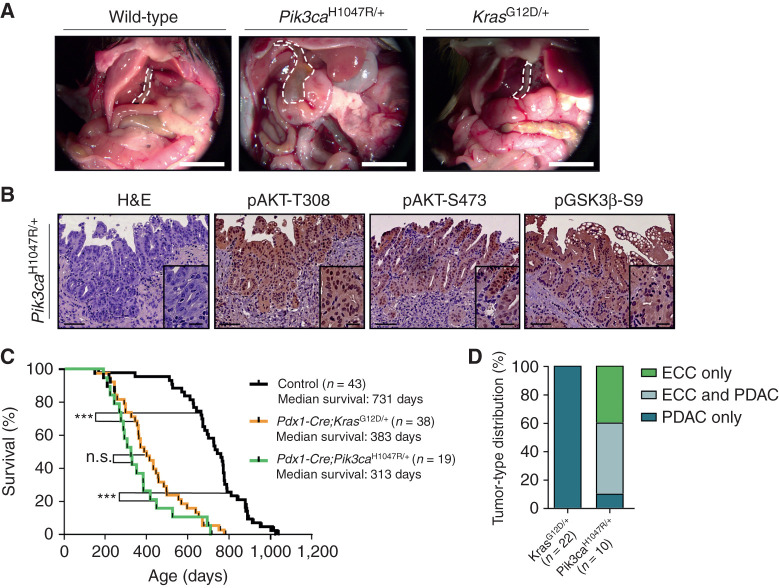
Figure 2. Expression of oncogenic Pik3caH1047R but not KrasG12D induces ECC. A, Representative in situ images of 12-month-old wild-type (control), Pdx1-Cre;LSL-Pik3caH1047R/+, and Pdx1-Cre;LSL-KrasG12D/+ mice. The common bile duct is outlined by a white dashed line. Scale bars, 1 cm. B, Representative hematoxylin and eosin (H&E) stainings and IHC analyses of PI3K/AKT pathway activation in the common bile duct of aged Pdx1-Cre;LSL-Pik3caH1047R/+ mice with invasive ECC. Scale bars, 50 μm for micrographs and 20 μm for insets. C, Kaplan–Meier survival curves of the indicated genotypes (n.s., not significant; ***, P < 0.001, log-rank test). D, Tumor-type distribution in percentage according to histologic analysis of the extrahepatic bile duct and the pancreas from Pdx1-Cre;LSL-KrasG12D/+ and Pdx1-Cre;LSL-Pik3caH1047R/+ mice.

Expression of oncogenic Pik3caH1047R but not KrasG12D induces ECC. A, Representative in situ images of 12-month-old wild-type (control), Pdx1-Cre;LSL-Pik3caH1047R/+, and Pdx1-Cre;LSL-KrasG12D/+ mice. The common bile duct is outlined by a white dashed line. Scale bars, 1 cm. B, Representative hematoxylin and eosin (H&E) stainings and IHC analyses of PI3K/AKT pathway activation in the common bile duct of aged Pdx1-Cre;LSL-Pik3caH1047R/+ mice with invasive ECC. Scale bars, 50 μm for micrographs and 20 μm for insets. C, Kaplan–Meier survival curves of the indicated genotypes (n.s., not significant; ***, P < 0.001, log-rank test). D, Tumor-type distribution in percentage according to histologic analysis of the extrahepatic bile duct and the pancreas from Pdx1-Cre;LSL-KrasG12D/+ and Pdx1-Cre;LSL-Pik3caH1047R/+ mice.