. 2021 Jul 19;11(12):3158–3177. doi: 10.1158/2159-8290.CD-21-0209

Figure 3.

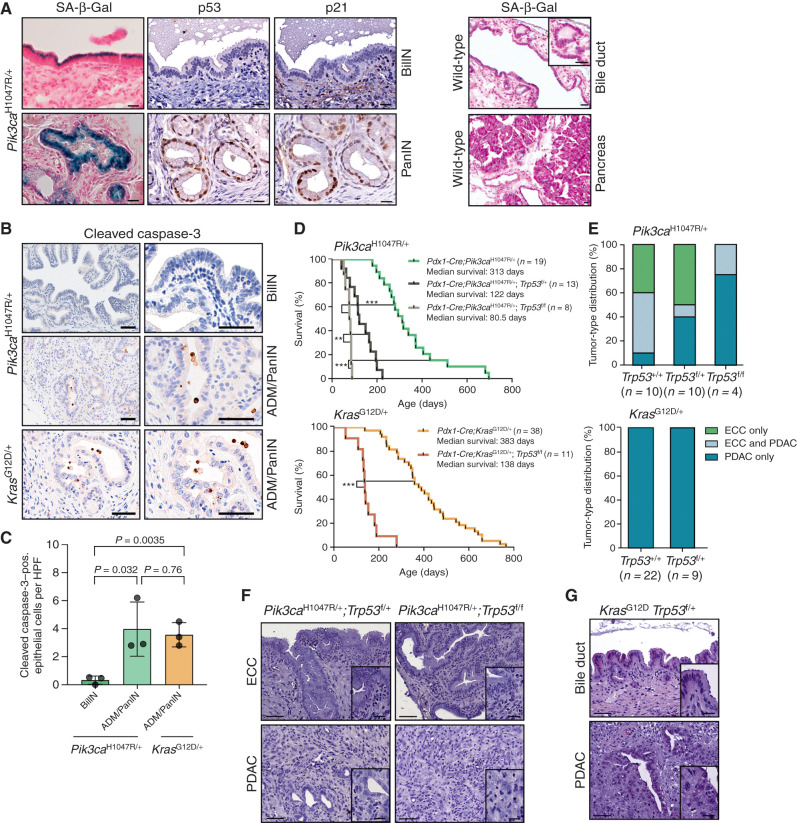
Figure 3. Oncogenic PI3K signaling induces senescence in the extrahepatic bile duct that is independent of the Trp53 pathway. A, Left, representative SA-β-Gal staining, and p53 and p21 IHC of BilIN (top) and PanIN (bottom) lesions of a Pdx1-Cre;Pik3caH1047R/+ mouse. Right, representative SA-β-Gal staining of wild-type extrahepatic bile duct and pancreas. Scale bars, 20 μm. B, Representative IHC cleaved caspase-3 staining of BilIN and ADM/PanIN of a Pdx1-Cre;LSL-Pik3caH1047R/+ mouse and an ADM/PanIN of Pdx1-Cre;LSL-KrasG12D/+ mouse. Scale bars, 50 μm. C, Quantification of cleaved caspase-3–positive epithelial cells in BilIN and ADM/PanIN lesions of the indicated genotypes. Each dot represents one animal (mean ± SD; P values are indicated, two-tailed Student t test). HPF, high-power field; pos., positive. D, Kaplan–Meier survival curves of the indicated genotypes (**, P < 0.01; ***, P < 0.001, log-rank test). E, Top: tumor-type distribution according to histologic analysis of the extrahepatic bile duct and pancreas of Pdx1-Cre;LSL-Pik3caH1047R/+, Pdx1-Cre;LSL-Pik3caH1047R/+;p53f/+, and Pdx1-Cre;LSL-Pik3caH1047R/+;p53f/f mice. Note: Reduced ECC fraction in mice with the Pdx1-Cre;Pik3caH1047R/+;p53f/f genotype (P = 0.02, Fisher exact test). Bottom: tumor-type distribution according to histologic analysis of the extrahepatic bile duct and pancreas of Pdx1-Cre;LSL-KrasG12D/+ and Pdx1-Cre;LSL-KrasG12D/+;p53f/+ mice. F, Representative hematoxylin and eosin (H&E) staining of ECC and PDAC of Pdx1-Cre;LSL-Pik3caH1047R/+;p53f/+ and Pdx1-Cre;LSL-Pik3caH1047R/+;p53f/f mice. G, Representative H&E staining of the common bile duct and PDAC of a Pdx1-Cre;LSL-KrasG12D/+;p53f/+ mouse. Scale bars, 50 μm for micrographs and 20 μm for insets. The Pdx1-Cre;Pik3caH1047R/+ and Pdx1-Cre;LSL-KrasG12D/+ cohorts shown in D and E are the same as those shown in Fig. 2C and D.

Oncogenic PI3K signaling induces senescence in the extrahepatic bile duct that is independent of the Trp53 pathway. A, Left, representative SA-β-Gal staining, and p53 and p21 IHC of BilIN (top) and PanIN (bottom) lesions of a Pdx1-Cre;Pik3caH1047R/+ mouse. Right, representative SA-β-Gal staining of wild-type extrahepatic bile duct and pancreas. Scale bars, 20 μm. B, Representative IHC cleaved caspase-3 staining of BilIN and ADM/PanIN of a Pdx1-Cre;LSL-Pik3caH1047R/+ mouse and an ADM/PanIN of Pdx1-Cre;LSL-KrasG12D/+ mouse. Scale bars, 50 μm. C, Quantification of cleaved caspase-3–positive epithelial cells in BilIN and ADM/PanIN lesions of the indicated genotypes. Each dot represents one animal (mean ± SD; P values are indicated, two-tailed Student t test). HPF, high-power field; pos., positive. D, Kaplan–Meier survival curves of the indicated genotypes (**, P < 0.01; ***, P < 0.001, log-rank test). E, Top: tumor-type distribution according to histologic analysis of the extrahepatic bile duct and pancreas of Pdx1-Cre;LSL-Pik3caH1047R/+, Pdx1-Cre;LSL-Pik3caH1047R/+;p53f/+, and Pdx1-Cre;LSL-Pik3caH1047R/+;p53f/f mice. Note: Reduced ECC fraction in mice with the Pdx1-Cre;Pik3caH1047R/+;p53f/f genotype (P = 0.02, Fisher exact test). Bottom: tumor-type distribution according to histologic analysis of the extrahepatic bile duct and pancreas of Pdx1-Cre;LSL-KrasG12D/+ and Pdx1-Cre;LSL-KrasG12D/+;p53f/+ mice. F, Representative hematoxylin and eosin (H&E) staining of ECC and PDAC of Pdx1-Cre;LSL-Pik3caH1047R/+;p53f/+ and Pdx1-Cre;LSL-Pik3caH1047R/+;p53f/f mice. G, Representative H&E staining of the common bile duct and PDAC of a Pdx1-Cre;LSL-KrasG12D/+;p53f/+ mouse. Scale bars, 50 μm for micrographs and 20 μm for insets. The Pdx1-Cre;Pik3caH1047R/+ and Pdx1-Cre;LSL-KrasG12D/+ cohorts shown in D and E are the same as those shown in Fig. 2C and D.