. 2021 Jul 19;11(12):3158–3177. doi: 10.1158/2159-8290.CD-21-0209

Figure 7.

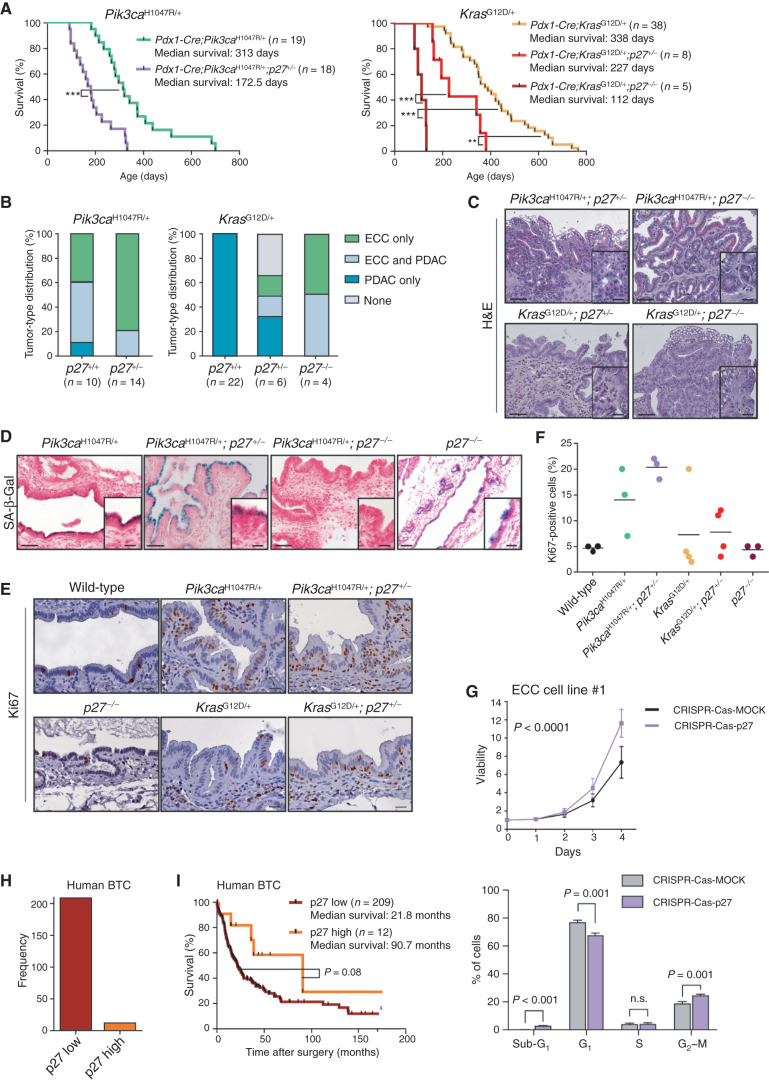
Figure 7. p27Kip1 is a context-specific roadblock for Kras-induced ECC formation. A, Kaplan–Meier survival curves of the indicated genotypes (***, P < 0.001; **, P < 0.01, log-rank test). B, Tumor type distribution according to histologic analysis of the extrahepatic bile duct and pancreas from Pdx1-Cre;LSL-Pik3caH1047R/+ and Pdx1-Cre;LSL-Pik3caH1047R/+;p27+/− mice (left) and Pdx1-Cre;LSL-KrasG12D/+, Pdx1-Cre;LSL-KrasG12D/+;p27+/−, and Pdx1-Cre;LSL-KrasG12D/+;p27−/− animals (right). Significant increase of ECC development in mice with the Pdx1-Cre;LSL-KrasG12D/+;p27−/− genotype (P < 0.0001, Fisher exact test). C, Representative hematoxylin and eosin (H&E) staining of the common bile duct of aged Pdx1-Cre;LSL-Pik3caH1047R/+;p27+/−, Pdx1-Cre;LSL-Pik3caH1047R/+;p27−/−, Pdx1-Cre;LSL-KrasG12D/+;p27+/−, and Pdx1-Cre;LSL-KrasG12D/+;p27−/− mice. D, Representative SA-β-Gal staining of the common bile duct of Pdx1-Cre;LSL-Pik3caH1047R/+, Pdx1-Cre;LSL-Pik3caH1047R/+;p27+/−, Pdx1-Cre;LSL-Pik3caH1047R/+;p27−/−, and p27−/− mice. C and D, Scale bars, 50 μm for micrographs and 20 μm for insets. E, Representative images of Ki67-stained common bile duct tissue sections of 3-month-old wild-type (control), Pdx1-Cre;LSL-Pik3caH1047R/+, Pdx1-Cre;LSL-Pik3caH1047R/+;p27+/−, p27−/−, Pdx1-Cre;LSL-KrasG12D/+, and Pdx1-Cre;LSL-KrasG12D/+;p27+/− mice. Scale bars, 20 μm. F, Quantification of Ki67-positive biliary epithelial cells of indicated genotypes. Each dot represents one animal, and the horizontal line represents the mean. G, Top: viability assay of primary murine ECC cell line #1 from a Pdx1-Cre;LSL-Pik3caH1047R/+ mouse after CRISPR-Cas9–mediated deletion of p27Kip1 (Cdkn1b). Cells were transfected with either Cas9-sgRNA-p27Kip1 targeting Cdkn1b (CRISPR-Cas-p27) or a MOCK Cas9-sgRNA-MOCK vector, selected using puromycin, and cell viability was measured in triplicate using the MTT assay (n = 4 independent experiments; mean ± SD; P < 0.0001, two-way ANOVA). Bottom: FACS-based cell-cycle analysis of the cells shown in the top panel. The P values were determined with multiple t tests and Benjamini correction and are shown in the figure. n.s., not significant. H, Quantification of p27Kip1 expression by IHC of 221 surgically resected human BTC specimens. I, Kaplan–Meier survival curves of patients with BTC with low or high p27Kip1 protein abundance (P = 0.08, log-rank test). The Pdx1-Cre;Pik3caH1047R/+ and Pdx1-Cre;LSL-KrasG12D/+ cohorts shown in A and B are the same as those shown in Fig. 2C and D.

p27Kip1 is a context-specific roadblock for Kras-induced ECC formation. A, Kaplan–Meier survival curves of the indicated genotypes (***, P < 0.001; **, P < 0.01, log-rank test). B, Tumor type distribution according to histologic analysis of the extrahepatic bile duct and pancreas from Pdx1-Cre;LSL-Pik3caH1047R/+ and Pdx1-Cre;LSL-Pik3caH1047R/+;p27+/− mice (left) and Pdx1-Cre;LSL-KrasG12D/+, Pdx1-Cre;LSL-KrasG12D/+;p27+/−, and Pdx1-Cre;LSL-KrasG12D/+;p27−/− animals (right). Significant increase of ECC development in mice with the Pdx1-Cre;LSL-KrasG12D/+;p27−/− genotype (P < 0.0001, Fisher exact test). C, Representative hematoxylin and eosin (H&E) staining of the common bile duct of aged Pdx1-Cre;LSL-Pik3caH1047R/+;p27+/−, Pdx1-Cre;LSL-Pik3caH1047R/+;p27−/−, Pdx1-Cre;LSL-KrasG12D/+;p27+/−, and Pdx1-Cre;LSL-KrasG12D/+;p27−/− mice. D, Representative SA-β-Gal staining of the common bile duct of Pdx1-Cre;LSL-Pik3caH1047R/+, Pdx1-Cre;LSL-Pik3caH1047R/+;p27+/−, Pdx1-Cre;LSL-Pik3caH1047R/+;p27−/−, and p27−/− mice. C and D, Scale bars, 50 μm for micrographs and 20 μm for insets. E, Representative images of Ki67-stained common bile duct tissue sections of 3-month-old wild-type (control), Pdx1-Cre;LSL-Pik3caH1047R/+, Pdx1-Cre;LSL-Pik3caH1047R/+;p27+/−, p27−/−, Pdx1-Cre;LSL-KrasG12D/+, and Pdx1-Cre;LSL-KrasG12D/+;p27+/− mice. Scale bars, 20 μm. F, Quantification of Ki67-positive biliary epithelial cells of indicated genotypes. Each dot represents one animal, and the horizontal line represents the mean. G, Top: viability assay of primary murine ECC cell line #1 from a Pdx1-Cre;LSL-Pik3caH1047R/+ mouse after CRISPR-Cas9–mediated deletion of p27Kip1 (Cdkn1b). Cells were transfected with either Cas9-sgRNA-p27Kip1 targeting Cdkn1b (CRISPR-Cas-p27) or a MOCK Cas9-sgRNA-MOCK vector, selected using puromycin, and cell viability was measured in triplicate using the MTT assay (n = 4 independent experiments; mean ± SD; P < 0.0001, two-way ANOVA). Bottom: FACS-based cell-cycle analysis of the cells shown in the top panel. The P values were determined with multiple t tests and Benjamini correction and are shown in the figure. n.s., not significant. H, Quantification of p27Kip1 expression by IHC of 221 surgically resected human BTC specimens. I, Kaplan–Meier survival curves of patients with BTC with low or high p27Kip1 protein abundance (P = 0.08, log-rank test). The Pdx1-Cre;Pik3caH1047R/+ and Pdx1-Cre;LSL-KrasG12D/+ cohorts shown in A and B are the same as those shown in Fig. 2C and D.