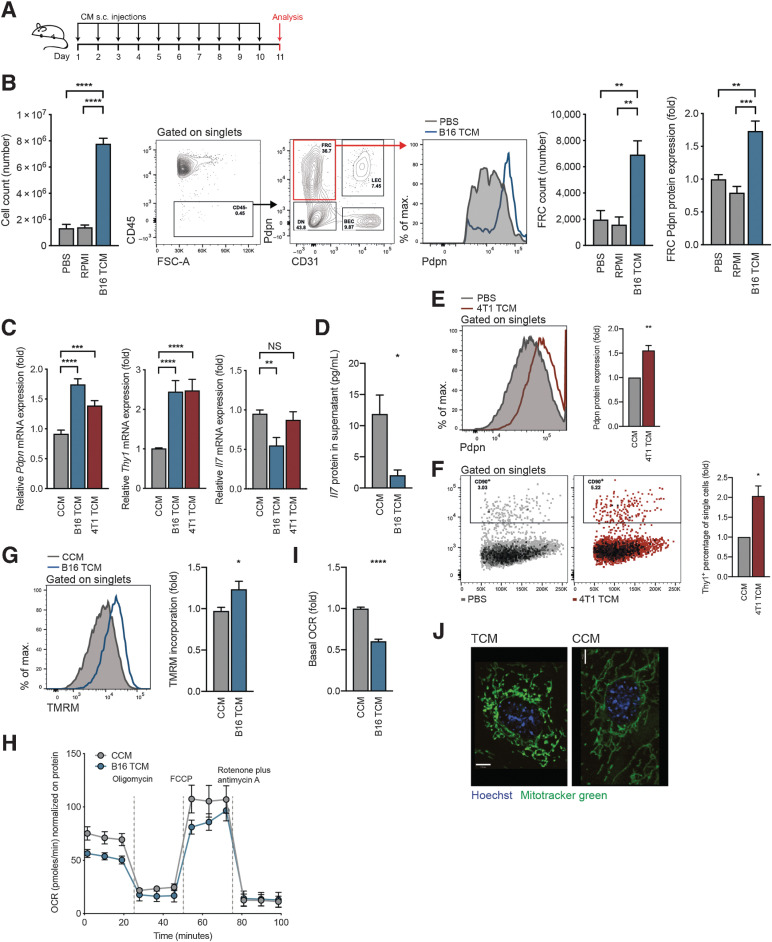
Figure 1.
Soluble factors mediate FRC activation and mitochondrial imbalance. A, Experimental scheme used to investigate tumor-draining factors in vivo. B, Draining lymph nodes were harvested from female C57BL/6 mice that had received 10 daily subcutaneous doses of PBS, RPMI medium, or B16.F10 TCM into the shoulder. Flow cytometric analysis allowed reporting of the total number of lymph node cells (left), flow cytometry gating scheme, FRCs (right), and FRC Pdpn histogram (furthest right). n = 4 to 9 animals per group. C, qRT-PCR analysis of Pdpn (left), Thy1 (middle), and Il7 (right) in FRCs cultured in vitro and treated for 4 days with CCM, B16.F10 TCM, or 4T1 TCM. n = 3 to 10 independent experiments. D, IL7 protein quantification in supernatants of FRCs cultured in vitro and treated with CCM or B16.F10 TCM, assessed by ELISA. n = 4 independent experiments. Flow cytometric quantification of Pdpn protein (E) and Thy1 protein (F) expression for FRCs cultured in vitro and treated with CCM or 4T1 TCM for 4 days. n = 3 independent experiments. G, Flow cytometric analysis of TMRM incorporation by FRCs treated for 4 days with CCM or B16 TCM. n = 4 independent experiments performed in triplicate. H, OCR of FRCs treated with CCM or B16.F10 TCM at baseline and in response to oligomycin, FCCP, and rotenone plus antimycin A. One representative of three experiments with five replicates. I, Baseline OCR from CCM or B16.F10 TCM-treated FRCs. n = 3 experiments with 5 replicates. J, Representative confocal imaging of live cells treated with CCM or B16.F10 TCM. Green, Mitochondria (Mitotracker green); blue, nuclei (Hoechst). Scale bar: 7 µm. Data are mean with SEM. Significance (*, P < 0.05; **, P < 0.01; ***, P < 0.001; and ****, P < 0.0001) was determined by unpaired two-tailed t test or one-way ANOVA with Tukey post hoc (B). s.c., subcutaneous; B16, B16.F10; max, maximum; NS, not significant.

