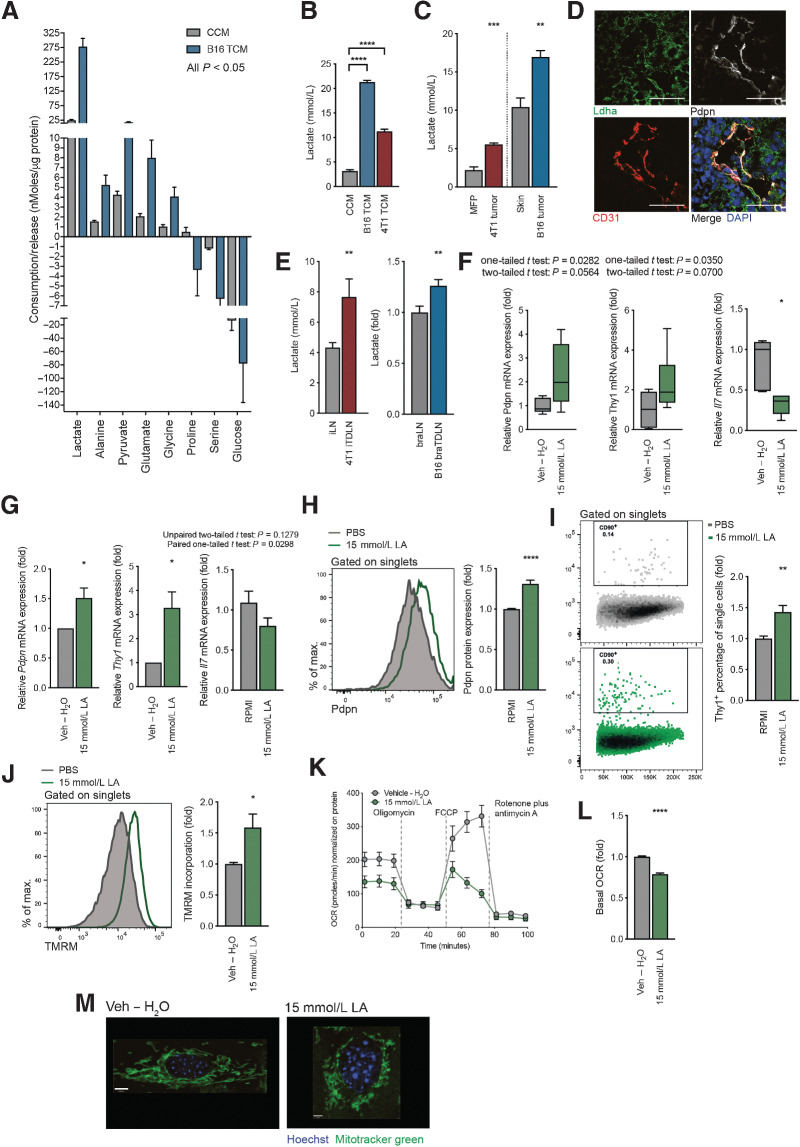
Figure 2.
Tumor-derived lactate is responsible for the observed changes in FRC activation and mitochondria. A, Metabolomic analysis of amino acids and glycolysis- and TCA cycle–intermediates in CCM or B16.F10 TCM using LC–MS. Metabolites with a significant (P < 0.05) FC are shown, ordered according to nMoles/µg protein of cultured cells. n = 5 independent experiments. B, L-lactate concentration in CCM, B16.F10 TCM, and 4T1 TCM, as measured by an enzymatic assay. n = 3 experiments with 1 to 5 replicates. C, L-lactate quantification in tissues collected from either Balb/c sham-treated mice (MFP) and orthotopic 4T1 tumors (4T1 tumor), or C57BL/6 sham-treated (skin) and B16.F10 melanoma tumors (B16 tumor). Measured by an enzymatic assay. n = 4 to 6 independent experiments. D, Confocal image of a B16.F10 tumor. Lymphatic vessels are detected with Pdpn (white) and CD31 (red). Ldha-positive tumor cells (green) and nuclei (blue). Scale bar: 100 µm. Representative of 3 experiments with 3 views each. E, Quantification of L-lactate concentration in lymph nodes from mice in (C).Inguinal lymph nodes (iLN) were harvested from sham-treated and orthotopic 4T1 tumor-bearing (4T1 iTDLN) Balb/c mice and L-lactate measured by an enzymatic assay. n = 2 to 7 biological replicates. Brachial lymph nodes (braLNs) were harvested from sham-treated and B16.F10 tumor-bearing C57BL/6 mice (B16 braTDLNs). L-lactate is shown as FC quantified by either the enzymatic assay or LC–MS. n = 17 biological replicates. F, Quantitation of Pdpn (left), Thy1 (middle), and Il7 (right) mRNA expression in FRCs of draining lymph nodes from female C57BL/6 mice receiving vehicle (Veh – H2O) or 15 mmol/L LA s.c. daily for 11 days. FRCs were FACS sorted as Pdpn+CD31–CD45–. Box and whiskers plot with whiskers minimum to maximum (line displays the median). Mean with SD. n = 4 animals with two lymph nodes for each experiment. G, Quantification of Pdpn (left), Thy1 (middle), and Il7 (right) mRNA in FRCs treated with vehicle (Veh – H2O) or 15 mmol/L LA for 4 days in vitro. n = 4 to 6 experiments. Flow cytometric quantification of Pdpn (H) and Thy1 protein expression (I), and TMRM incorporation (J) by FRCs treated with Veh – H2O or 15 mmol/L LA for 4 days in vitro. n = 5 experiments in triplicate (H). n = 3 experiments in triplicate (I). n = 4 experiments in duplicate (J). K, OCR of FRCs treated with vehicle (Veh – H2O) or 15 mmol/L LA at baseline and in response to oligomycin, FCCP, and rotenone plus antimycin A. Representative data of 3 experiments with 5 replicates. L, Baseline OCR from vehicle (Veh – H2O) and 15 mmol/L LA–treated FRCs. n = 4 experiments with 5 replicates. M, Representative confocal images of live cells treated with vehicle (Veh – H2O) or 15 mmol/L LA. Green, Mitochondria (Mitotracker green); blue, nuclei (Hoechst). Scale bars: 8 µm (vehicle), 3.3 µm (15 mmol/L LA). Representative of three independent experiments. Data are means with SEM. Significance (*, P < 0.05; **, P < 0.01; ***, P < 0.001; and ****, P < 0.0001) was determined by unpaired two-tailed t test or one-way ANOVA with Tukey post hoc (B). B16, B16.F10; max., maximum; min, minute; LA, lactic acid.

