Figure 3.
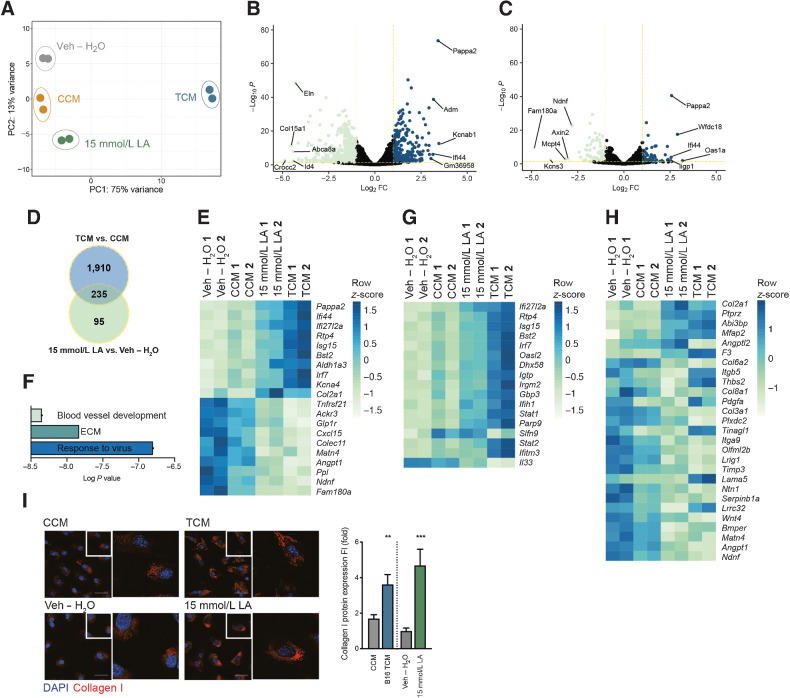
Tumor factors and LA induce FRC remodeling. A, PCA plot of RNA-seq data calculated for the 500 genes showing the highest variance in a variance stabilizing transformed matrix with log2-transformed data from in vitro FRCs treated with CCM, B16.F10 TCM, vehicle (Veh – H2O) or 15 mmol/L LA for 4 days. n = 2 biological replicates. B, Volcano plot comparing genes expressed by in vitro cultured FRCs treated for 4 days with TCM or CCM, the x-axis displays the significance (-log10P) and the y-axis displays the log2 FC. Yellow lines are at -log10P = 1.3 and log2 FC 0.68. The top and bottom five are labeled. C, Volcano plot comparing genes expressed by FRCs treated with 15 mmol/L LA or Veh – H2O for 4 days in vitro; plot labels as in (B). D, Overlap of genes significantly deregulated in FRCs treated with TCM versus CCM and 15 mmol/L LA versus Veh – H2O for 4 days in vitro. E, Heatmap displaying the top and bottom 10 most deregulated genes of the 235 genes overlapping in D. F, Summary of key pathways identified in in vitro cultured FRCs treated for 4 days with 15 mmol/L LA versus Veh – H2O using genes with -log10P < 1.3 and log2 FC > 0.68. Detailed analysis in Supplementary Fig. S2. G, Heatmap displaying significant deregulated genes in 15 mmol/L LA versus Veh – H2O (including data for TCM vs. CCM) within the ”response to virus”/IFN signature. H, Heatmap displaying significant deregulated genes in 15 mmol/L LA verus Veh – H2O (including data for TCM vs. CCM) within the ”ECM” signature. I, Confocal images of FRCs treated for 4 days with CCM, B16.F10 TCM, Veh – H2O, or 15 mmol/L LA and stained for collagen I (red) and nuclei (blue; left) and quantification thereof (right). n = 2 independent experiments each with 8 fields of view analyzed. Scale bar: 50 µm. Data are mean with SEM. Significance (*, P < 0.05; **, P < 0.01; ***, P < 0.001; and ****, P < 0.0001) was determined by unpaired two-tailed t test. B16, B16.F10.

