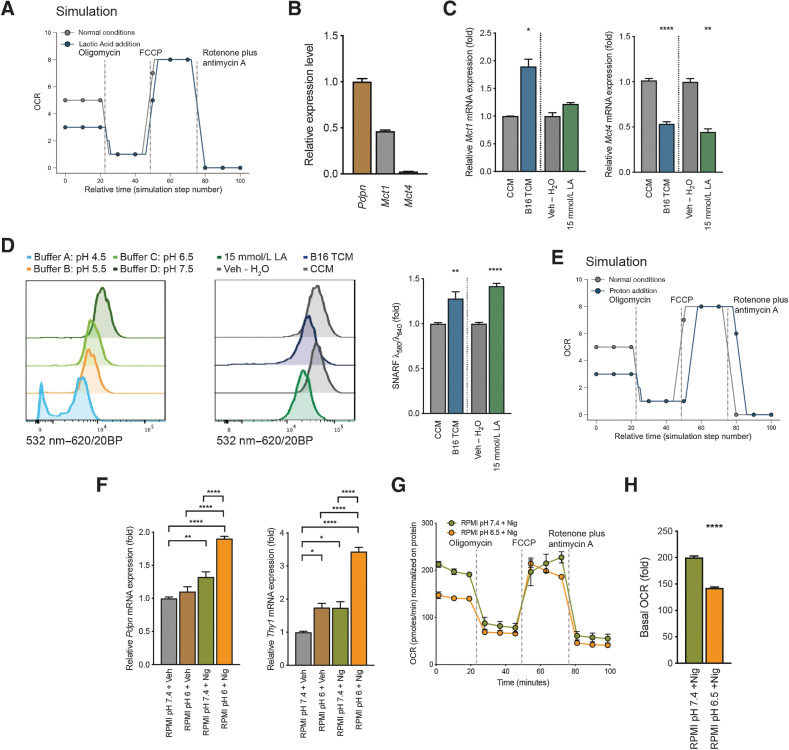
Figure 5.
Intracellular pH shift of FRCs contributes to mitochondrial changes and the observed signature. A, Metabolic analysis of mitochondrial function in the computational model. Shown is OCR for mitochondria exposed to LA versus control. B, Quantification of Pdpn, Mct1, and Mct4 mRNA in cultured FRCs. Displayed as relative gene expression with Actb as housekeeping and Pdpn as reference gene. n = 3 independent experiments in duplicate. C, Quantification of Mct1 (left) and Mct4 (right) mRNA in FRCs treated with CCM, B16.F10 TCM, Veh – H2O, or 15 mmol/L LA for 4 days. n = 2 to 4 independent experiments. D, Intracellular pH of FRCs treated as in (C) and stained with cell-permeant ratiometric fluorescent pH indicator (SNARF). SNARF exhibits a pH-dependent emission shift calculated by λ586/λ610. Lower intracellular pHs give higher values. Control buffers used to adjust intracellular to extracellular pH (left). Representative histogram of the 532nm to 620/20BP shift for CCM, B16,F10 TCM, Veh – H2O, or 15 mmol/L LA (middle). Quantification thereof (right). n = 3 independent experiments in duplicate. E, Metabolic analysis of mitochondrial function in the computational model. Shown is OCR for mitochondria exposed to low pH (proton addition) versus control. F, Quantification of Pdpn (left) and Thy1 (right) mRNA in FRCs cultures after 48 hours of treatment with normal pH RPMI and vehicle (RPMI pH7.4 + Veh), normal pH RPMI and 100 nmol/L nigericin (RPMI pH7.4 + Nig), pH6 RPMI and vehicle (RPMI pH6 + Veh), or pH6 RPMI and 100 nmol/L nigericin (RPMI pH6 + Nig). n = 2 to 3 independent experiments in duplicate. G, OCR of FRCs treated with pH7.4 RPMI and 100 nmol/L nigericin (RPMI pH7.4 +Nig) or RPMI at pH6.5 and 100 nmol/L nigericin (RPMI pH6.5 +Nig) at baseline and in response to oligomycin, FCCP, and rotenone plus antimycin A. Representative data of three experiments each with five replicates. H, Baseline OCR from FRCs treated as in G. Data are mean with SEM (unless stated differently). Significance (*, P < 0.05; **, P < 0.01; ***, P < 0.001; and ****, P < 0.0001) was determined by unpaired two-tailed t test (A–E) and (G) or one-way ANOVA with Tukey post hoc (F). B16, B16.F10; LA, lactic acid; min, minutes.

