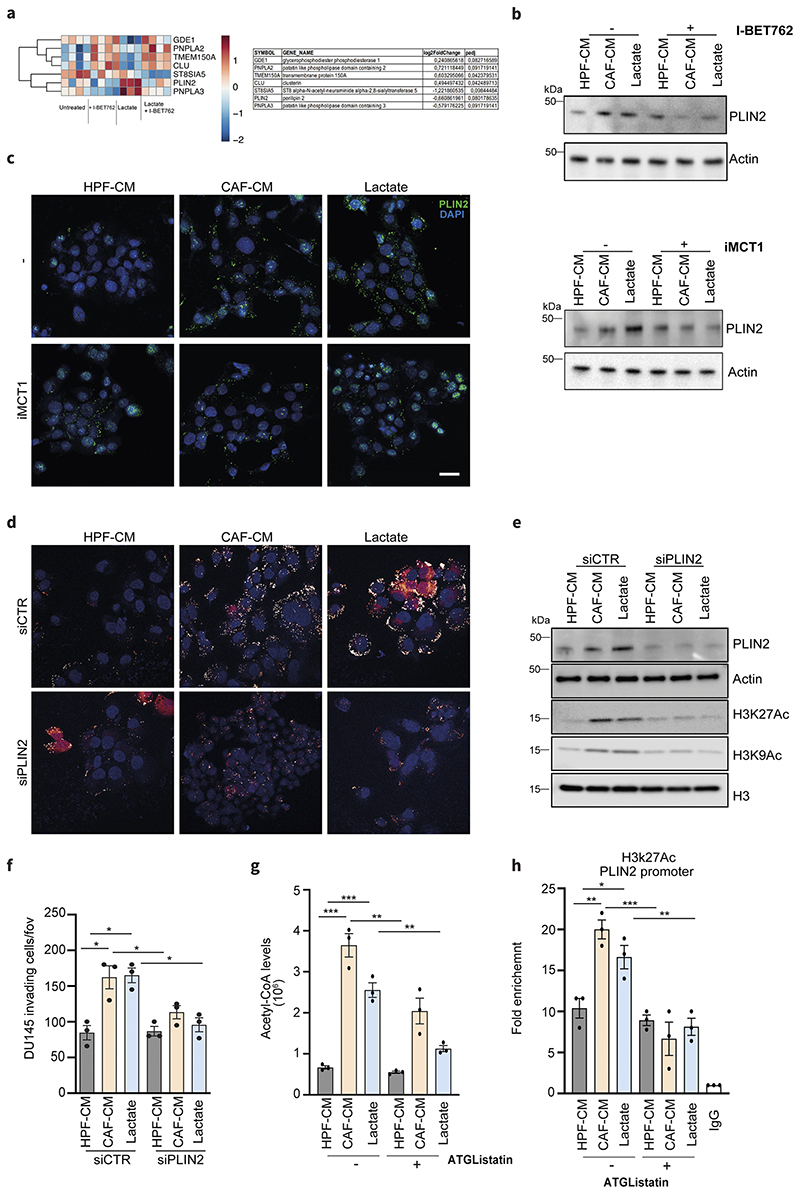
Figure 5. PLIN2 is a key player in metabolic-epigenetic interplay induced by lactate.
a) Lactate-dependent signature genes involved in lipid metabolism that are up- and down-modulated upon I-BET762 treatment in DU145 cells exposed to 15mM lactate for 48h. Relative log2FC and adjusted p-values are listed on the right. b) Immunoblot for PLIN2 levels in DU145 cells treated as above. c) Expression of PLIN2 evaluated by immunofluorescence or immunoblot in DU145 cells treated as indicated, ± iMCT1. Scale bar = 10 μm d-f) DU145 cells were silenced using the non-targeting control (siCTR) or PLIN2-specific siRNA and subsequently treated as indicated. LDs content analysis (d), immunoblot for H3K27ac and H3K9ac levels (e) and invasion assay (f) were performed in PLIN2-silenced DU145 cells using siCTR-treated cells as comparators. g) Acetyl-CoA levels were MS-evaluated in DU145 cells treated as indicated ± ATGListatin. e) ChIP-qPCR analysis of H3K27ac on PLIN2 promoters in DU145 cells in the indicated conditions. Enrichment as fold-enrichment relative to IgG is reported. One-way ANOVA; Tukey’s corrected; *p < 0.05; **p < 0.01; ***p < 0.001

