. 2022 Jan 27;21(4):594–606. doi: 10.1158/1535-7163.MCT-21-0532

Figure 4.

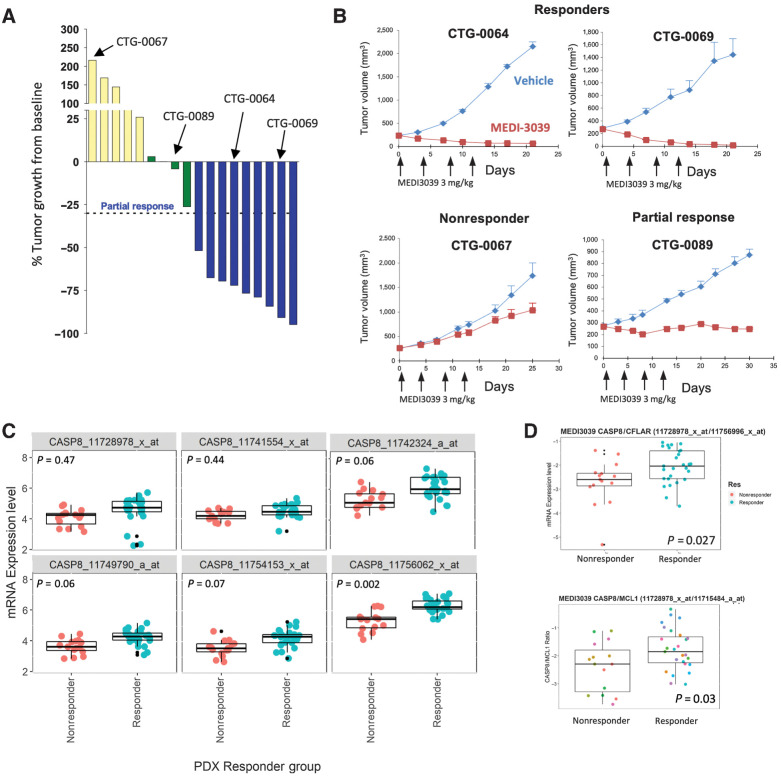
Figure 4. In vivo expression of CASP8 and CFLAR (FLIP) modulate response to MEDI3039 in PDX models. A, Change in percent tumor growth from baseline was measured at day 18 in 18 CRC PDX models treated with a fixed dose of MEDI3039. B, Tumor plots of responder, nonresponder, and partial response models. x-axis, days; y-axis, tumor volume. Arrows indicate treatment with MEDI3039. Red line, MEDI039-treated mice; blue line, untreated mice. C, Tumor CASP8 mRNA expression in PDX nonresponders (red) and responders (blue) with MEDI3039 (each circle represents a tumor from a single mouse). D, Comparison of CASP8:CFLAR ratio in MEDI3039 responder (blue) and nonresponder (red) PDX models.

In vivo expression of CASP8 and CFLAR (FLIP) modulate response to MEDI3039 in PDX models. A, Change in percent tumor growth from baseline was measured at day 18 in 18 CRC PDX models treated with a fixed dose of MEDI3039. B, Tumor plots of responder, nonresponder, and partial response models. x-axis, days; y-axis, tumor volume. Arrows indicate treatment with MEDI3039. Red line, MEDI039-treated mice; blue line, untreated mice. C, Tumor CASP8 mRNA expression in PDX nonresponders (red) and responders (blue) with MEDI3039 (each circle represents a tumor from a single mouse). D, Comparison of CASP8:CFLAR ratio in MEDI3039 responder (blue) and nonresponder (red) PDX models.