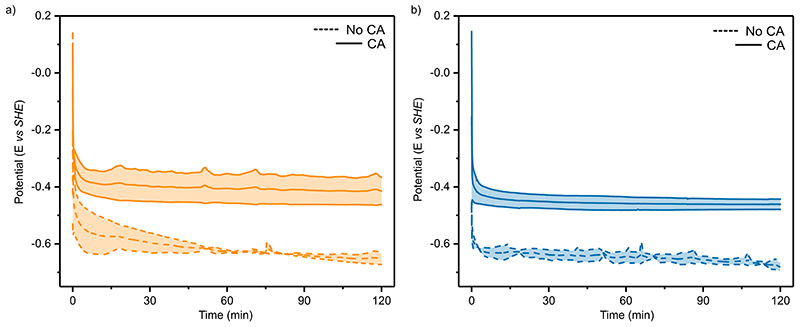
Extended Data Fig. 5. Protein film chronopotentiometry.
Protein film chronopotentiometry (a) Measured potentials for galvanostatically controlled HER (-0.18 mA cm−2) by H2ase (20 pmol) in the absence (dashed lines) and presence (solid lines) of co-immobilised CA (40 pmol). (b) Measured potentials for galvanostatically controlled CO2R (-0.24 mA cm−2) by FDh (50 pmol) in the absence (dashed lines) and presence (solid lines) of co-immobilised CA (40 pmol). Lines are the average of at least 3 independent galvanostatic measurements, where the shaded area represents the standard deviation. Solution conditions: CO2 purged 0.1 M KHCO3 and 0.05 M KCl (pH 6.67). All experiments conducted at 20°C.

