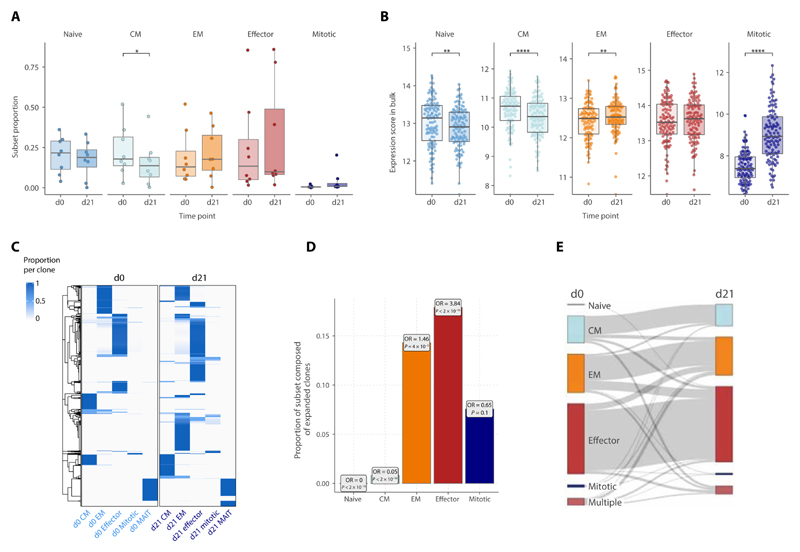
Fig. 2. Dynamic immune composition changes upon ICB.
(A and B) Changes in the proportion of each cell subset between pretreatment (d0) and d21 post-ICB (d21) as determined by (A) scRNA-seq (n = 8, two-sided Wilcoxon signed-rank test) or (B) inferred from bulk RNA-seq data (n = 110, two-sided Wilcoxon signed-rank test). For the bulk RNA-seq inference, subset scores were calculated for each bulk RNA-seq sample based on a list of markers that distinguished each subset at both pretreatment and d21 post-ICB in the scRNA-seq data (the “Bulk RNA-seq” section; fig. 2, A and B). (C) TCR sharing heatmap between d0 and d21 CD8+ T cell subsets, showing T cell clones consisting of more than 1 detected clone and their relative presence and subset proportions at each time point. (D) Proportion within each subset at d21 of clones that have significantly expanded from d0 (boxes contain odds ratios of enrichment of clones expanded at d21 within each subset, P values by Fisher’s exact test). (E) Sankey plot tracking the cell subset phenotype of d0 clones at d21. For each clone, the subset in which most of its members were present in at a given time point was designated as the predominant subset for that clone; “multiple” indicates clones equally distributed across multiple subsets. The width of the connecting flowline represents the number of clones with the respective d0 and d21 subset phenotypes.

