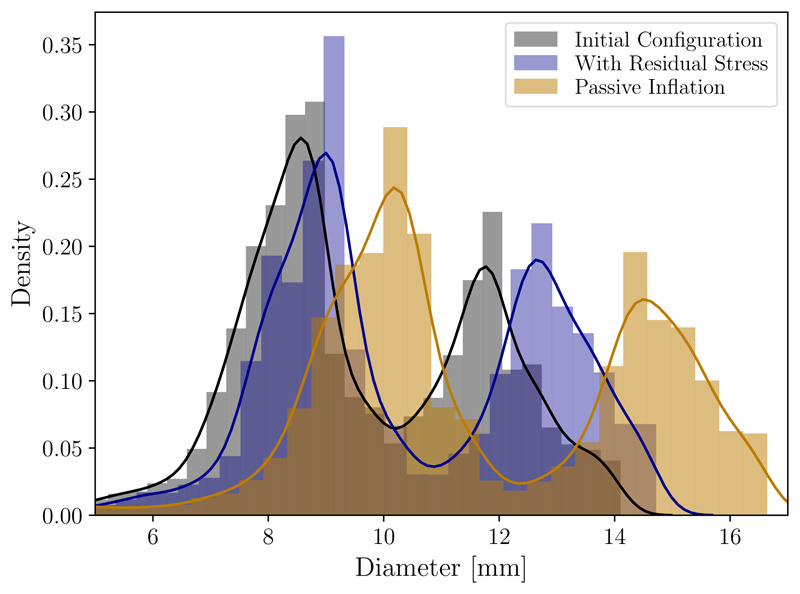
Figure 10.
Density plot and histogram of diameters measured in the original geometry taken from imaging (black) in comparison with the displacement field of an passive inflation experiment (yellow, see Figure 9A) and an inflation with residual stress (blue, see Figure 9C). Diameters were computed as the diameters of the maximal inscribed spheres along the centerline of the geometries.

