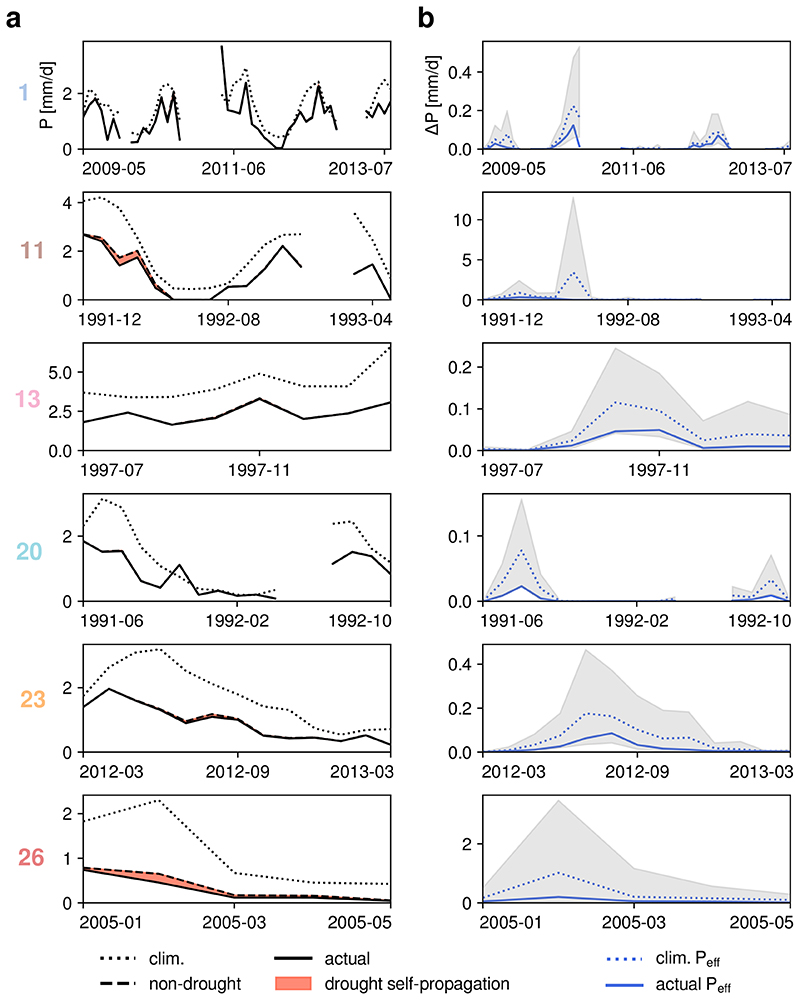
Fig. 2. Upwind soil droughts propagation to downwind precipitation deficits.
a, For the same six events as in Fig. 1b–d, the climatological and actual precipitation are shown (dotted and solid black lines). The extra water vapor for non-drought conditions in Fig. 1d is converted to precipitation based on the actual precipitation efficiency (dashed black line; see main text and Methods), shown as the ensemble mean. The difference between non-drought and actual precipitation is an estimate of the drought self-propagation effect (red shading). b, Since this difference in precipitation (ΔP) depends not only on the amount of extra water evaporating at climatological soil moisture stress, but also on the conversion of water vapor to precipitation, the values corresponding to the actual precipitation efficiency employed for Fig. 2a, the climatological mean, maximum and minimum precipitation efficiency are shown (solid and dashed blue lines, upper and lower bounds of hatched grey shading), again averaged over the entire ensemble of simulations.

