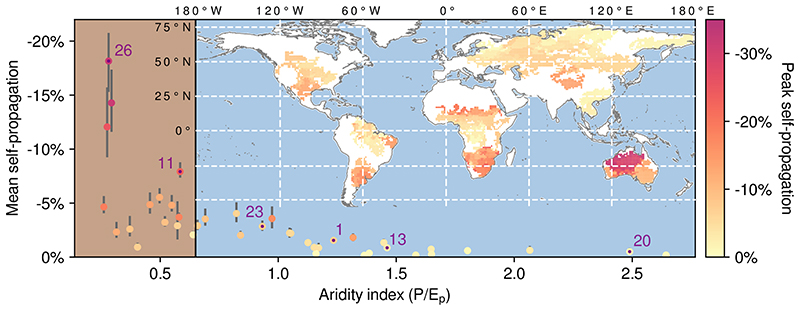
Fig. 3. Droughts self-propagation in drylands.
The map illustrates the monthly maximum (or ‘peak’) drought self-propagation, expressed as the ratio between the change in precipitation induced by drought self-propagation (ΔP) and the precipitation expectation without upwind drought. If several events overlap in space, their average is visualized. Only the ensemble mean is shown. The graph illustrates the mean drought self-propagation per event (including all propagation steps) as a function of the climatological aridity index (the ratio of annual mean precipitation over potential evaporation). Marker colours indicate the (monthly) peak self-propagation. Vertical grey lines represent the uncertainty range, given by the respective ensemble minima and maxima. The transition to drylands at P/Ep=0.65 (the ratio of precipitation and potential evaporation; ref. 36 ) is marked by a vertical black line and a change in background colour (from blue to brown). The six events highlighted in Figs. 1 and 2 are labelled and marked with purple dots.

