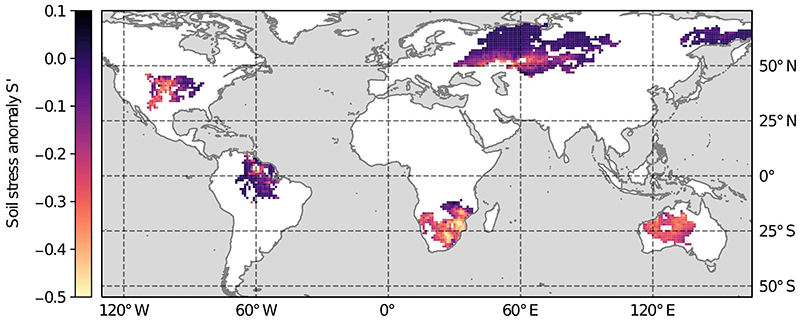
Extended Data Fig. 3. Soil stress S during the six highlighted droughts.
S, given by the ratio of E over Ep , is expressed as anomalies with respect to the climatological mean. This is calculated per pixel and using only months for which drought conditions were present according to the morphed droughts—in other words, the climatology is obtained analogously to the drought values, for the same months (or seasons), but based on 1980–2016. Brighter colors imply more soil stress (lower S) and thus more severely water-limited evaporation.

