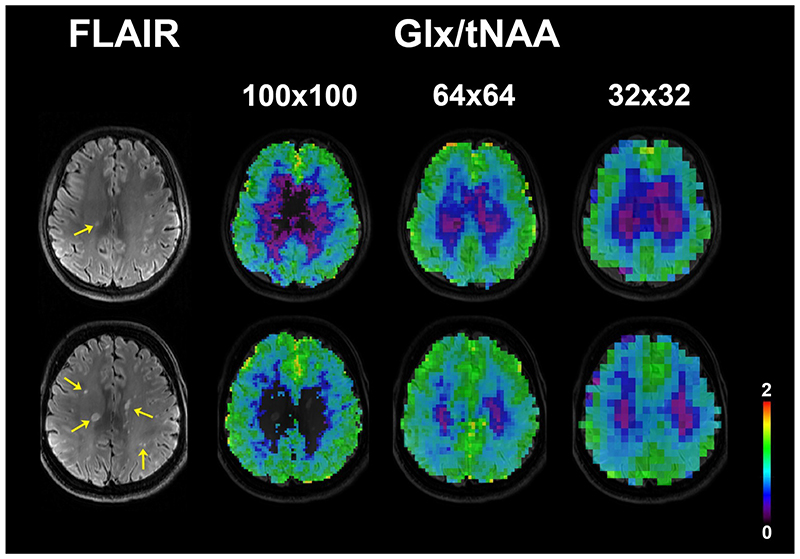
Figure 7.
Examples of Glx/tNAA metabolic maps at three MRSI resolutions from three different patients. Only voxels with Cramér-Rao lower bounds of Glx below 50% were included. At ultra-high resolution the spectral quality in many multiple sclerosis lesions (yellow arrows on FLAIR image) was not sufficient for Glx quantification.
(FLAIR = fluid-attenuated inversion recovery, tNAA = N-acetylaspartate + N-acetylaspartylglutamate, Glx = glutamate + glutamine)

