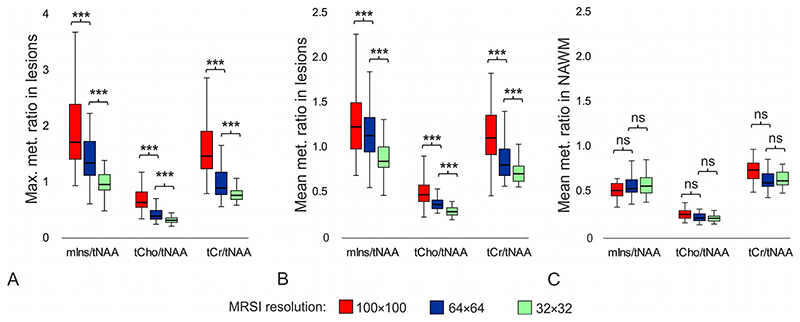
Figure 8.
Boxplots with a) maximum and b) mean values of metabolic ratios in multiple sclerosis lesions, and c) mean values of metabolic ratios in NAWM obtained with different MRSI spatial resolutions; i.e. with 100×100, 64×64, and 32×32 matrix size. Each boxplot contains 77 values.
(***=p<0.001, ns = not significant, NAWM = normal-appearing white matter, tNAA =N-acetylaspartate + N-acetylaspartylglutamate, tCr = creatine + phosphocreatine, tCho = phosphocholine + glycerophosphocholine, mlns = myo-inositol)

