Fig. 13. 3D–0D model of the heart.
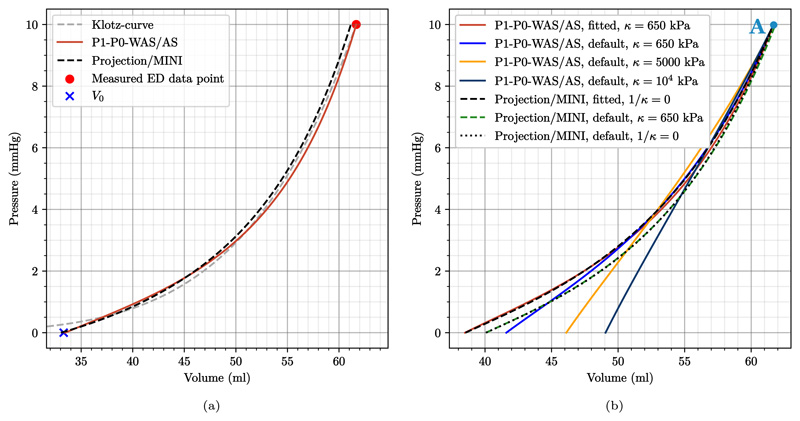
Passive model calibration and unloading following Marx et al. [108]. (a) An ex-vivo setup was used to calibrate the passive material parameters to fit the EDPVR of Klotz et al. [107]; (b) Calibrated as well as default material parameters, see Table 3, were used in an in-vivo setup to generate prestress using a backward-displacement scheme. Shown are the final loading curves. Note that loading curves for P1–P0-WAS and P1–P0-AS coincide and are thus only given once. The same applies for projection-stabilized and MINI elements. The marker “A” denotes the time-point for stress plots in Figs. 16 and 18.

