Fig. 15. 3D–0D model of the heart.
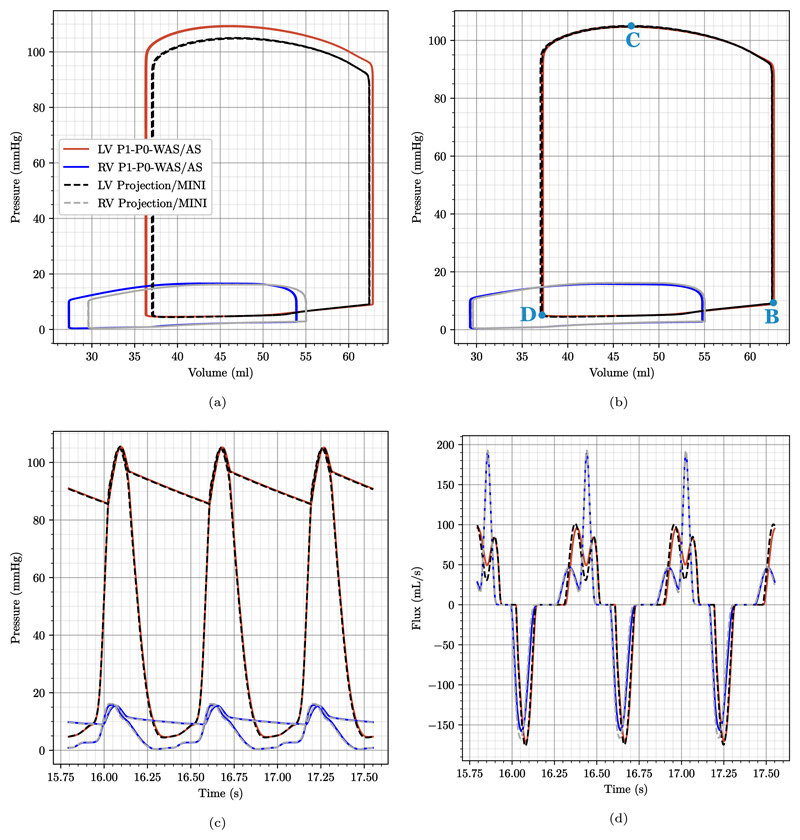
Plot comparing data traces for the P1–P0-WAS formulation (LV: red lines, RV: blue lines) and for the MINI and stabilized P1–P1 elements (LV: black dashed lines, RV: gray dashed lines). Shown are the last 3 beats of the simulation with (a) same active stress and preload parameters for P1–P0-WAS and locking free elements and (b–d) modified active stress and preload parameters for P1–P0-WAS elements to obtain matching PV loops. In particular we show: (a,b) converged PV-loops for both ventricles; (c) pressure trace for the LV and RV and pressure in the respective outflow vessel; (d) in- (negative values) and outflow (positive values) traces of both ventricles. “B”, “C”, “D” mark time-points for stress plots in Figs. 17 and 19.

