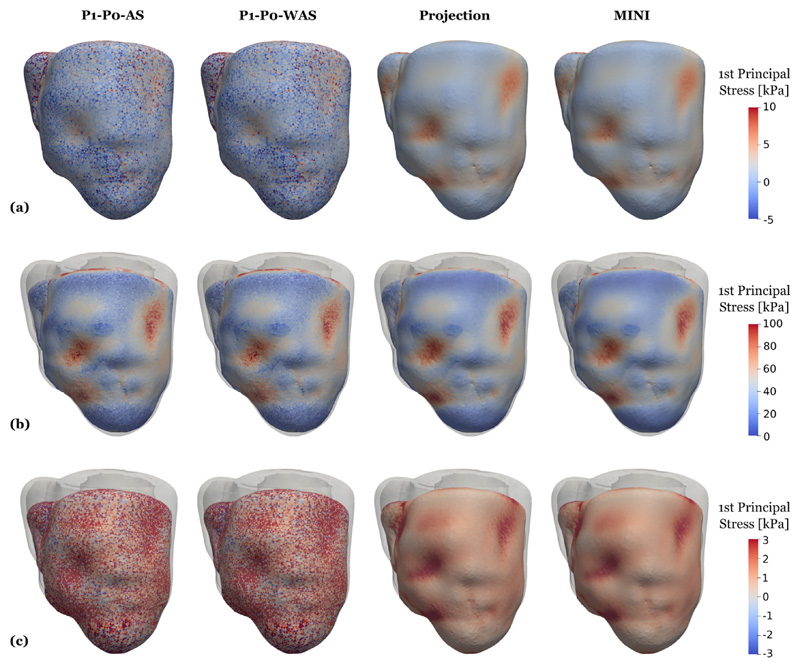
Fig. 17. 3D–0D model of the heart.
Snapshots of first principal stress values at end-diastole (first row), peak systole (second row), and at mitral valve opening (third row), see Fig. 15 “B”, “C”, “D” for a visualization of the time-points. Shown is element-wise total stress which is not smoothed. Gray outlines indicate the end-diastolic configuration. Compared are P1–P0-AS elements (first column), P1–P0-WAS elements (second column) stabilized P1–P1 elements (third column), and MINI elements (fourth column).

