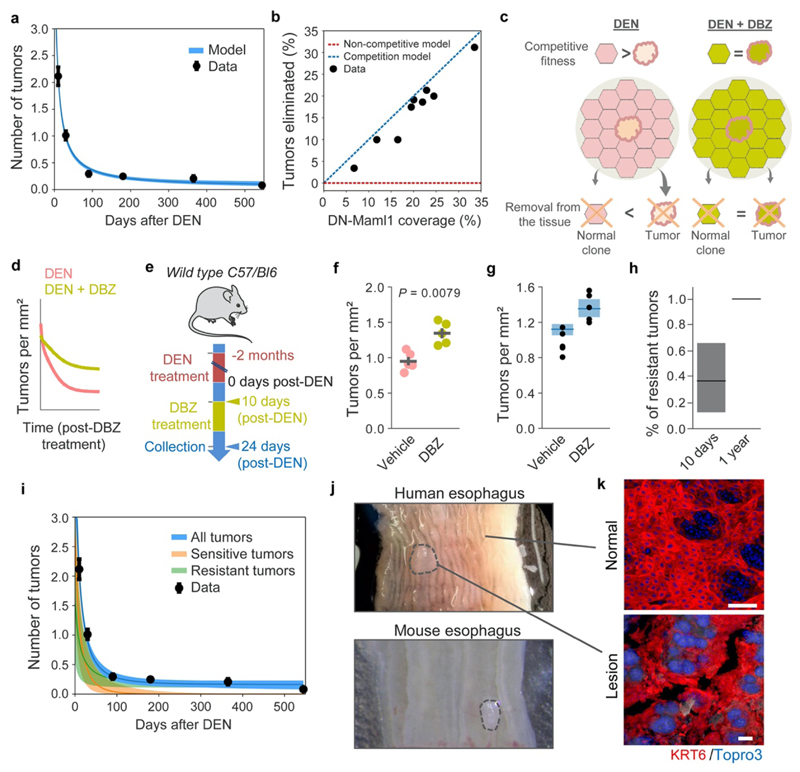
Extended Data Figure 10. Increasing competitive fitness throughout the epithelium slows down tumor loss. Human esophageal lesions.
A stochastic drift model (Supplementary Note) fit to the observed number (mean±s.e.m) of tumors following DEN treatment. (b) Experimentally observed (black dots) and model predicted (dashed lines) % of tumors eliminated when highly fit mutant clones (such as DN-Maml1) are induced in esophageal epithelium following DEN-treatment. Dashed lines represent models where the induced mutant clones remove tumors they encounter (blue) or where tumor loss is independent of clones in the surrounding tissue (red) (Supplementary Note). (c) Cartoon illustrating the predicted effects of DBZ administration. When clones in the normal surrounding epithelium have a higher competitive fitness than the tumors, the probability that tumors will be eliminated from the tissue may be higher (left) than when administration of DBZ levels the competition between the clones and tumors (right). (d) Qualitative representation of tumor dynamics following DBZ vs. control treatment. (e) Protocol: wild-type mice were treated with DEN for two months. Ten days post-DEN withdrawal mice received DBZ or vehicle control. Tissues were harvested two weeks later. (f-g) Experimental (f) and simulated (g, Supplementary Note) tumors per mm2 of esophageal epithelium in DBZ and vehicle control treated mice (n=5 mice/group). Lines in (f) are mean±s.e.m (two-tailed Mann-Whitney test). Black dots in (g) show experimental data. (h-i) Numerical example (see Supplementary Note) of the model showing increased proportion of tumors resistant to displacement by mutant clones (h) and the decrease in tumor density following DEN-treatment (i). Experimental data depicts mean±s.e.m. (j) Images of human (top) and mouse (bottom) esophagus. Dotted lines delineate lesions. (k) Confocal images of human normal (top) and neoplastic (bottom) esophageal epithelium stained with KRT6 (red) and Topro3 (nuclei, blue). Scale-bars: 100μm. Simulations in (a, g, h and i) show the mean and range between the minimum-maximum outputs of the model run with the accepted parameters from Approximate Bayesian Computation (Methods).

