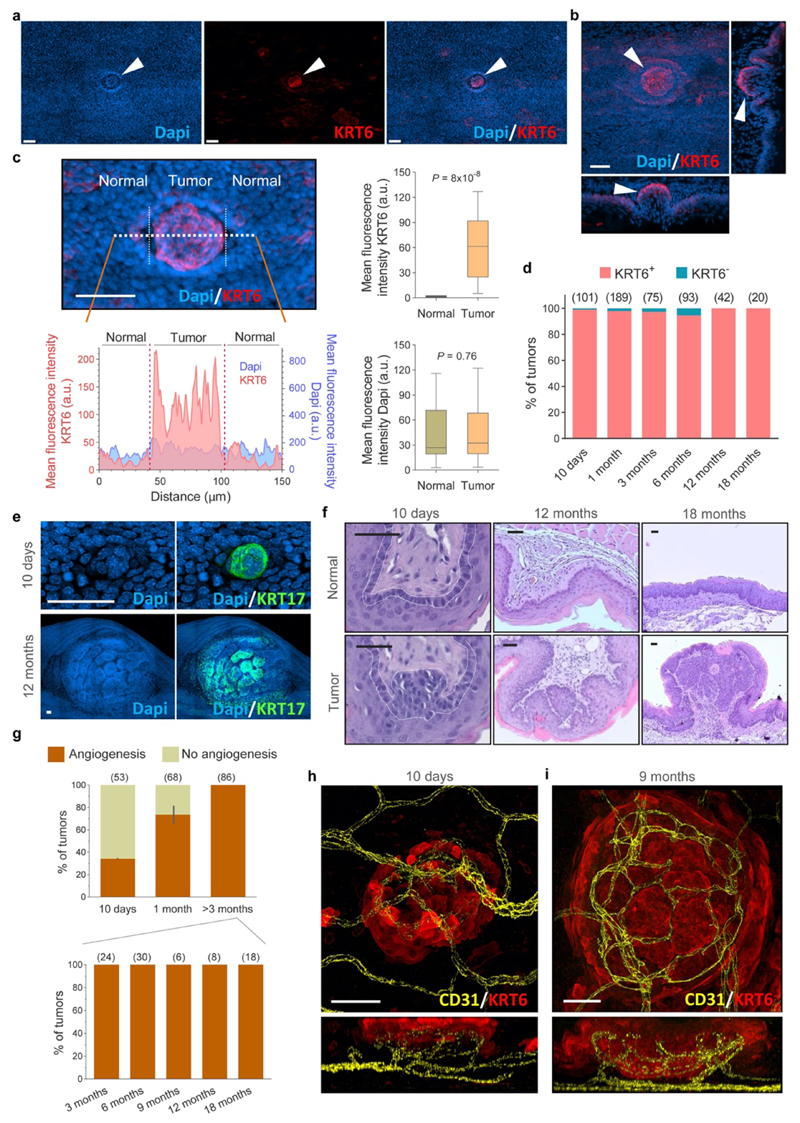
Extended Data Figure 2. Characterization of Diethyl Nitrosamine (DEN) generated tumors.
(a, b) Confocal images of esophagus collected 10 days post-DEN treatment and stained with Dapi and KRT6. Images show top-down (a, b) and lateral (b) projections and illustrate typical morphological features and expression of KRT6 in tumors (arrowheads) and normal surrounding epithelium. (c) Quantification of the mean fluorescence intensity of KRT6 and Dapi in 10 days post-DEN tumors and the adjacent normal epithelium, measured from the images as shown. Two-sided Mann-Whitney test, n=48 tumors from 3 mice. (d) Percentage of tumors positive for KRT6 staining. The number of tumors analyzed for each time point is shown between brackets. (e) Confocal images of 10-days and 12-months post-DEN tumors showing increased expression of KRT17 (green). Images are representative of 31 and 29 tumors, from 3 and 7 mice, respectively. (f) H&E images of esophageal tumors (bottom images) and normal epithelium (top images) from tissues collected at the indicated time points post-DEN treatment. (g) Percentage of angiogenic tumors at the indicated time points post-DEN treatment. The number of tumors analyzed at each time point is shown in brackets. (h, i) Projected top-down and lateral confocal images of 10 day (h) and 9 months (i) post-DEN tumors immuno-stained for the endothelial cell marker CD31 and KRT6. Images are representative of 18 and 6 tumors, respectively. Scale-bars for panels (a-c), (e-f) and (h-i) are 50μm.

