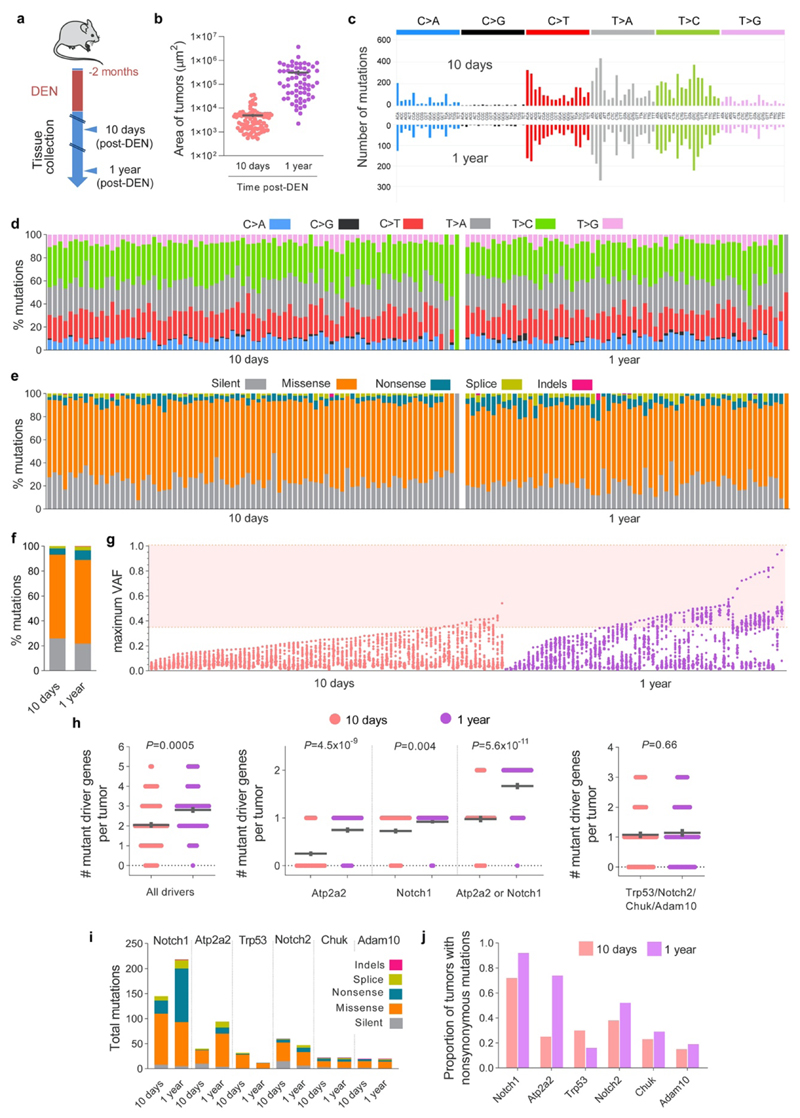
Extended Data Figure 4. Targeted sequencing of 10 days and 1 year tumors.
(a) Protocol: wild-type mice were treated with DEN for two months and the esophageal tumors collected 10-days or 1-year later. Tumors were then sequenced with a targeted approach (192 gene panel). (b) Area of 10-day and 1-year post-DEN tumors (n=89 and 64 tumors from 2 and 9 mice, respectively). Lines show mean ± s.e.m. (c) Mutational spectrum of 10-day and 1-year tumors. The bar plots illustrate the number of mutations in each of the 96 possible trinucleotides. The mutational spectrum of individual tumors is shown in (d). (e-f) Percentage of silent, missense, nonsense and splice mutations and indels identified in 10-day or 1-year tumors. Graphs show the values for individual tumors (e, each column is a tumor), or the average for all tumors at each time point (f). (g) Maximum VAF for mutations identified in each tumor at 10 days or 1 year post-DEN (n=80 and 63 tumors, respectively). Colored shadow illustrates VAF > 0.35, as an estimation for clonality. (h) Number of positively selected mutant genes in tumors at 10 days or 1 year post-DEN treatment (n=80 and 63 tumors, respectively). Lines show mean±s.e.m (two-tailed Mann-Whitney test). (i) Number and type of mutations in the positively selected genes identified by dN/dS analysis from 10-day or 1-year tumors. (j) Proportion of 10-day and 1-year tumors carrying nonsynonymous mutations in the indicated genes.

