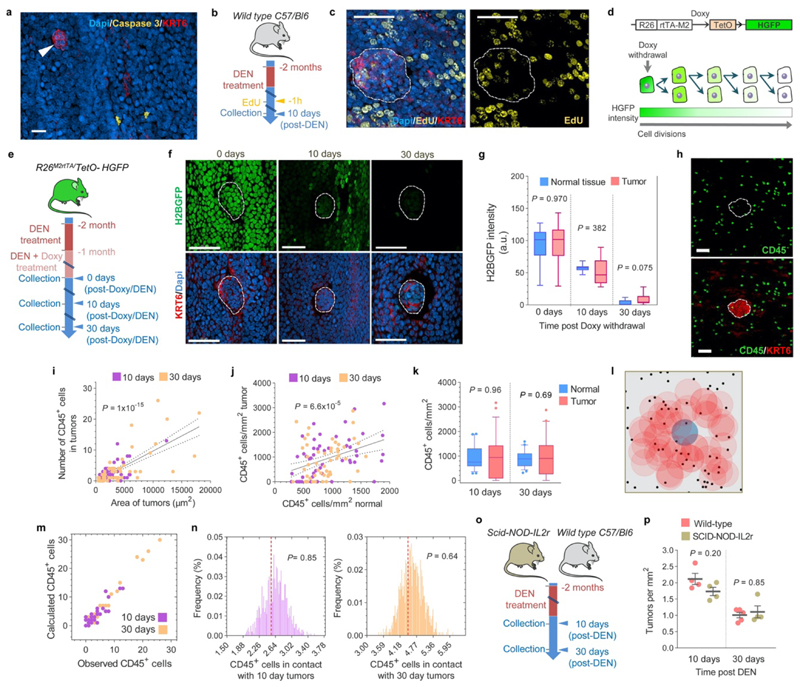
Extended Data Figure 6. Early tumors are not eliminated by tumor cell apoptosis, abnormal proliferation or the immune system.
(a) Representative confocal image of a 10-day post-DEN esophageal epithelium immuno-stained for activated Caspase 3+ (Yellow) and KRT6 (red). No apoptotic cells were detected in the tumors (arrowhead) (n=23 tumors, 2 mice). Scale-bar: 20μm. (b) Protocol: wild-type mice were treated with DEN for two months and the tissues collected ten days later. Mice received EdU 1h before tissue collection. (c) Representative confocal images showing EdU incorporation (1h pulse) in tumors (dotted line) and the surrounding normal epithelium (n=22 tumors, 3 mice). Scale-bars: 20μm. (d) In vivo label-retaining assay using Rosa26M2rtTA/TetO-HGFP transgenic mice to measure the rate of progenitor cell division (see Methods). (e) Protocol: Rosa26M2rtTA/TetO-HGFP mice received DEN for one month followed by DEN+Doxy for another month. Tissues were collected at times 0, 10 and 30 days after Doxy/DEN withdrawal. (f-g) Representative confocal images (f) and quantification (g) of the histone-green fluorescent protein (H2BGFP) intensity in esophageal tumors (dotted lines) and the surrounding normal epithelium at the indicated time points post-Doxy withdrawal. Scale bars: 50μm. Graph shows median (central box line), 25th-75th percentiles (box) and 5th-95th percentiles (whiskers). Two-tailed Mann-Whitney test (n=10 images per group). (h) Confocal images depicting CD45+ (immune) cells (green) within a 10-days post-DEN tumor (white dotted line) and its adjacent normal epithelium. (i-j) Correlation between the size of tumors and the number of CD45+ cells within them (i) and the number of CD45+ cells in the tumor and the normal epithelium (j). Lines show the two-tailed Pearson correlations: R2=0.5039 (i), and R2=0.1464 (j), with 95% confidence interval (dotted lines). (k) Number of CD45+ cells per area of tumor or normal esophageal epithelium at 10- or 30-days post-DEN treatment. Graph shows median (central box line), 25th-75th percentiles (box), 5th-95th percentiles (whiskers) and outliers (dots). Two tailed Wilcoxon matched-pairs test, n=53 and 50 images, respectively. (l) Permutation analysis of leukocyte location within tumors, based on the experimental measurements obtained from (h). For each image, the location of CD45+ cells (black dots) was left intact while the location of the tumor (colored circles) was randomly shuffled (blue shows original location, red shows shuffled “phantom” tumors), and the number of immune cells in contact with the tumor was counted. This was repeated 1000 times to produce the expected distribution. (m) Calculated (within the original location) vs. experimentally observed number of CD45+ cells in 10- or 30-days post-DEN tumors. (n) Distribution of the average number of CD45+ cells in 10- or 30-days post-DEN tumors, obtained from the permutation analysis in (l). Red dotted line shows the experimentally observed average number of CD45+ cells within tumors at the indicated time-points. Statistics are two-tailed permutation tests (Methods). (o) Protocol: Wild-type and immunocompromised Scid-NOD-IL2r mice were treated with DEN for two months and the tissues collected 10 or 30 days post-DEN withdrawal. (p) Tumor density in mice collected 10-days (n=4) or 30-days (n=5 and 4, respectively) post-DEN treatment. Mean±s.e.m (two-tailed Mann-Whitney test).

