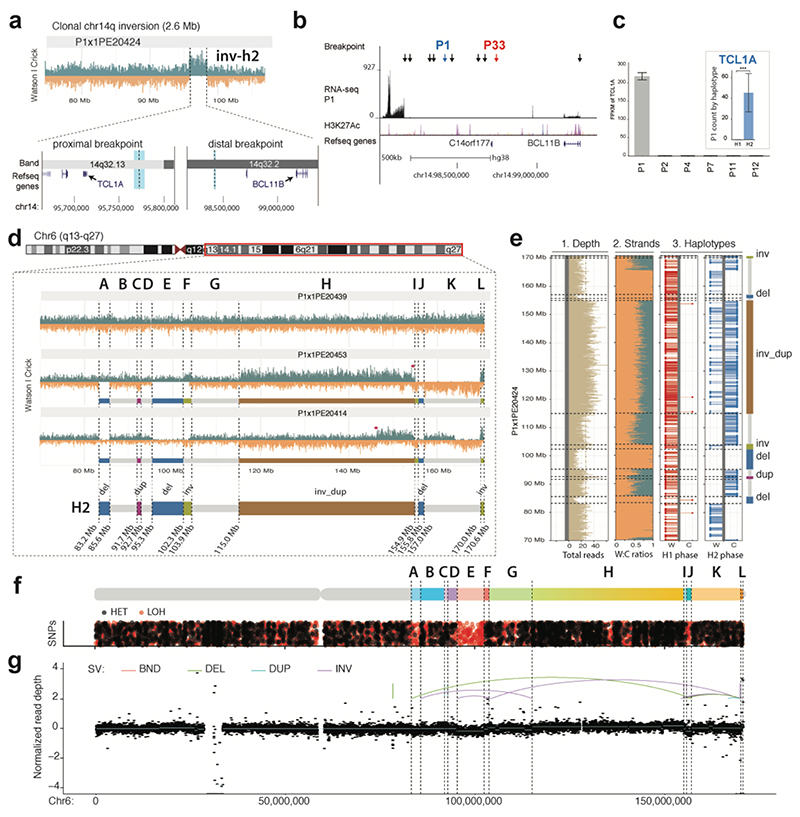
Figure 6. Single cell sequencing of PDX-derived T-ALL relapse P1 reveals previously unrecognized SVs.
(a) Haplotype-resolved balanced 14q32 Inv inferred in P1 using scTRIP. The leftmost breakpoint (thick light blue line) resides close to TCL1A, whereas the rightmost breakpoint (thin light blue line) is in 3′ of BCL11B. (b) The rightmost Inv breakpoint falls into a “gene desert” region in 3′ BCL11B containing several enhancers. Black arrows show breakpoints of translocations resulting in T-ALL oncogene dysregulation from a recent study45. Colored arrows: 41 SV breakpoints in T-ALL donors P1 and P33. (c) Dysregulation of TCL1A in conjunction with 14q32 Inv. Larger barplot shows TCL1A overexpression in P1 compared to five arbitrarily chosen T-ALLs (FDR=2.3E22 two-sided Wald test with Benjamini-Hochberg correction). Inset barplot shows allele-specific RNA-seq analysis demonstrating TCL1A dysregulation occurs only on the inverted (H2) haplotype (FDR 6.68E-21 two-sided pairwise likelihood ratio test with Benjamini-Hochberg correction). The center values in the graph indicates mean of independent biological replicates (n=2 for P1, P4, P7, P11, P12; n=3 for P2). ***p<0.001. (d) Reconstruction of subclonal clustered DNA rearrangements at 6q via scTRIP. (e) Haplotype-resolved analysis of SVs clustered at 6q, all of which fall onto haplotype H2. (f) Detection of interspersed losses and retention of LOH in conjunction with the clustered SVs, indicative for a DNA rearrangements burst41. (LOH, signified by an abundance of red dots, was called as reported in the Methods. Regions with normal density of reference heterozygous SNPs (red), but with decreased density of additionally detected heterozygous SNPs (black), are indicative for LOH.) (g) Verification of subclonal clustered rearrangement burst at 6q, by bulk long-insert size paired-end sequencing75 to 165X physical coverage. Breakpoints inferred by scTRIP are shown as dotted lines, and scTRIP-inferred segments are denoted using the letters A to L. Colored breakpoint-connecting lines depict the paired-end mapping based rearrangement graph (i.e., deletion-type, tandem duplication-type, and inversion-type paired-ends). Using bulk whole-exome and mate-pair sequencing, read-depth shifts at these breakpoints were subtle and thus, this subclonal complex rearrangement escaped prior de novo SV detection efforts in bulk.

