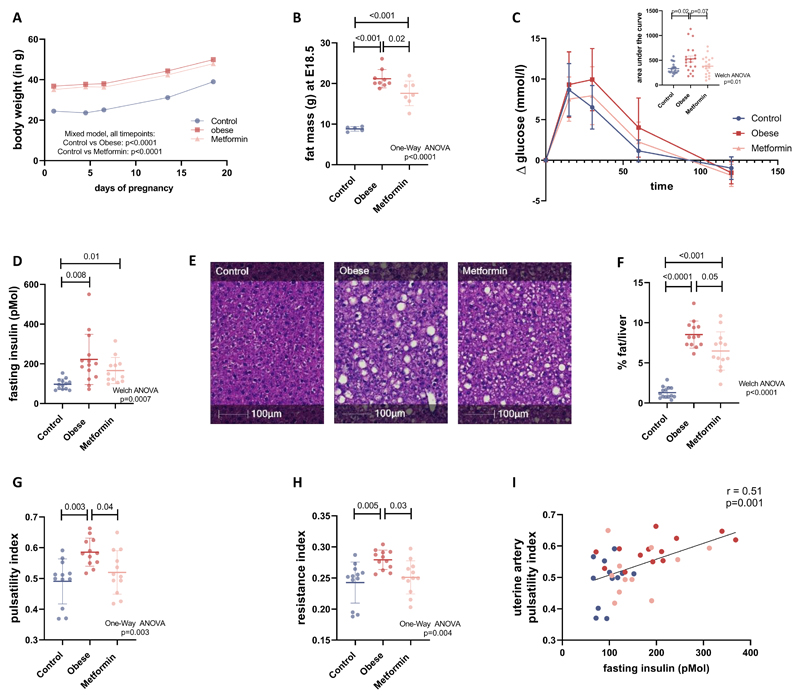
Figure 2. Maternal characteristics.
(A) Bodyweight of the dams was measured at day of the plug (E0.5), day 4.5, 6.5, 13.5 and 18.5 of gestation (n=14 for control, n=14 for obese, n=13 for metformin dams), mean ± SD and mixed model analysis is shown. (B) On day 18.5 fat mass was measured via TD-NMR (n=5 for control, n=9 for obese, n=7 for metformin dams). (C). An ipGTT was performed after a 4-hour fast on day 17.5 of pregnancy and glucose levels were measured and presented as the difference to the starting glucose level (n=20 for control, n=20 for obese, n=19 for metformin dams). The insert Figure shows the area under the curve, mean ± SD and Welch ANOVA analysis are shown. (D) Fasting insulin levels were measured and mean ± SD and Welch ANOVA analysis are shown (n=13 for control, n=14 for obese, n=13 for metformin dams). (E) Liver sections were stained with Haematoxylin and Eosin (representative images shown) and (F) the fat vacuole content quantified with HALO image analysis platform as a percentage of the whole liver section (n=14 for control, n=13 for obese, n=14 for metformin dams). (G) Pulsatility and (H) resistance indices were calculated and corrected for individual maternal heart rates (n=12 for all three groups). (I) Fasting insulin levels were correlated with uterine artery pulsatility index and linear correlation and Pearson correlation coefficient r are shown. If not indicated differently statistical analyses in the Figure show One-Way ANOVA followed by Tukey’s multiple comparison test, error bars show mean ± SD.

