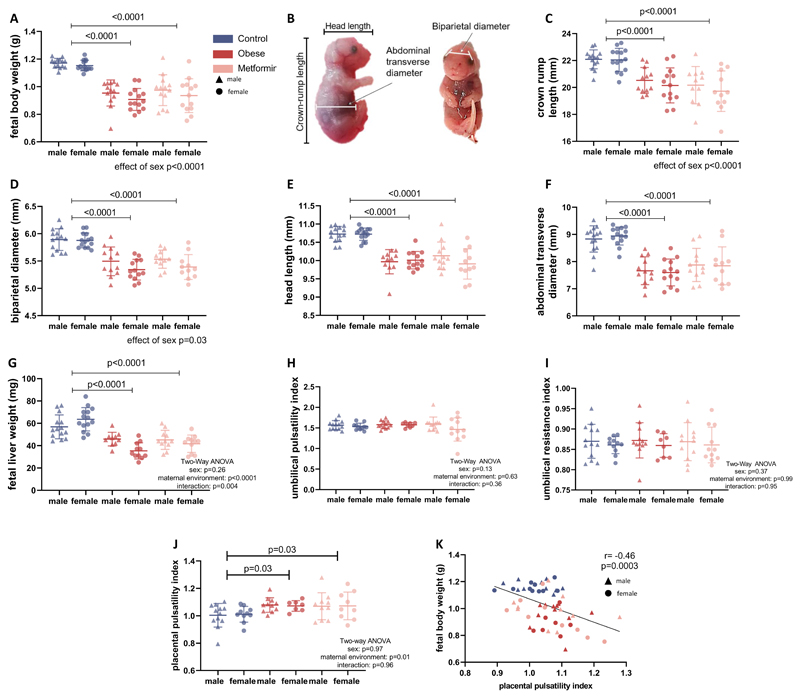
Figure 3. Fetuses from obese untreated and obese metformin-treated dams show symmetric growth restriction.
(A) Fetal weight was taken at E18.5 (n=14/14 dams for male/female control, n=13/14 dams male/female obese and n=13/13 dams for male/female metformin fetuses). (B) Fetal biometry was performed as shown and (C) crown-rump length, (D) biparietal diameter, (E) head length and (F) abdominal transverse diameter measured. For the fetal biometry n=14/14 dams for male/female control, n=12/13 dams for male/female obese and n=11/11 dams for male/female metformin fetuses are shown. Analysis is performed with a linear mixed model accounting for the dam as a random effect, in the graphs the mean ± SD per litter and sex is shown. (G) Fetal liver weights were taken at E18.5 in n=14/14 dams for male/female control, n=10/11 dams for female/male obese fetuses and n=11/11 dams, male/female metformin fetuses from mean ± SD and Two-Way ANOVA analysis is shown. (H) The umbilical pulsatility index (PI) and (I) resistance index were measured via ultrasound, analysis shows n=13/11 dams for male/female control, n=12/8 dams for male/female obese and n=12/11 dams for male/female metformin fetuses and Two-Way ANOVA (sex and maternal environment) with Tukey’s multiple comparison test. (J) The placental pulsatility index (PPI) was calculated via the following formula: mean uterine artery PI + mean umbilical artery PI) / 2, n=12/10 dams for male/female control, n=11/7 dams for male/female obese and n=10/9 dams for male/female metformin fetuses and Two-Way ANOVA analysis is shown. (K) The PPI was correlated with the fetal body weight, linear correlation and Pearson correlation coefficient r are shown.

